High Yield’s Wild Year
The high-yield market has a history of transformation, whether it’s during the technology-media-telecommunications phase of the early 2000s, the Great Financial Crisis or the current COVID-19 pandemic.
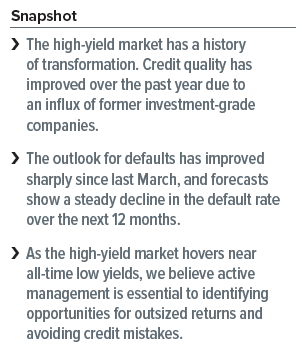
Today, we’re setting records or revisiting milestones that we haven’t encountered in years. The high-yield market, as measured by the ICE BofA US High Yield Constrained Index, breached a 4% market yield in February for the first time, falling to a record low of 3.95%. The average price in 2021 exceeded $105 for the first time since July 2014.
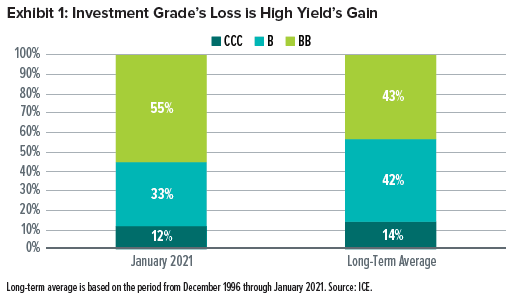
High-yield credit quality has also improved over the past year (Exhibit 1). BB rated bonds hit an all-time high Index share of 57% during July 2020 (and were holding at 55% in January) compared to a long-term average of 43%.
The investment-grade market’s loss has been the high-yield market’s gain. An influx of fallen angels (investment-grade companies that have been downgraded to high yield) has been the primary contributor to the migration toward higher quality. This shift has been mostly at the expense of B rated bonds, while the impact on CCC rated bonds has been a bit more muted.
Turning back the clock
At the time, January 2020 seemed like an unremarkable month. The high-yield market had returned 14.41% in 2019, ending the year with a 5.41% yield, and was more or less unchanged in January.
Then COVID-19 began to cross borders, and its anticipated economic impact spilled over into financial markets. The high-yield market was down by 1.55% in February—starting a massive selloff that finally hit bottom on March 23. The damage through the March low was stark:
- High-yield market performance was down by 20.57% year to date
- The market yield climbed to 11.40%—the highest level since August 2009
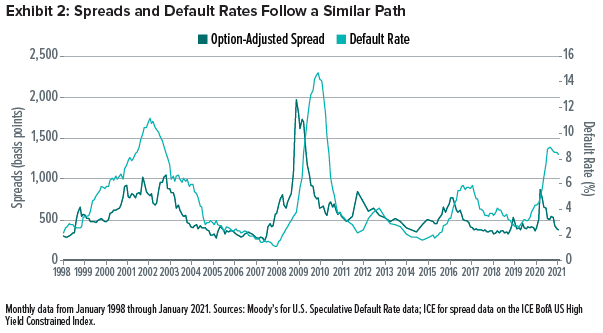
- The market spread reached a towering 1,087 basis points—the highest since June 2009
- The average price had fallen to $78.60—the lowest since June 2009
The Federal Reserve’s (Fed) quick action in resurrecting the playbook from the Great Financial Crisis—with some important modifications—succeeded in flooding markets with liquidity and avoiding a financial catastrophe. This time, the Fed acted quicker than it did in 2008. It also went further, buying high-yield corporate bonds and exchange-traded funds (ETFs) for the first time.
Financial markets were receptive to the Fed’s actions. The high-yield market rallied by 9% in the final six trading days of March, shrinking the year-to-date loss through March 31 to 13.13%. Markets continued to regain confidence over the last three quarters of 2020: the high-yield market registered positive returns in every month except for September (-1.04%), finishing with a full-year return of 6.07%.
Issuance and investor demand
Corporations took full advantage of the opportunity to access capital markets following the Fed’s interventions. $72.9 billion came to market during the first quarter of 2020; then, the new-issue market exploded during the final three quarters of the year. 2020 was the first calendar year to exceed $400 billion in new issues, with total new issuance of $450 billion. Refinancing was the primary use of proceeds (66.1%), followed by general corporate purposes at 24.7%, which was the highest share since 2000 (39.1%).
Investors had fled high yield in a significant way during the first quarter of 2020, with $15.4 billion of outflows. As the market rebounded, investors—in their constant search for yield, and now for total return as well—jumped back into high yield with $44 billion of inflows during the second quarter of 2020 alone. Another $15 billion of inflows during the second half of 2020 resulted in a net inflow of $43.6 billion for the calendar year.
Default rate environment
In March 2020, Moody’s baseline forecast for the U.S. speculative-grade default rate was pegged at 14.4% by March 2021. Fortunately, the default-rate environment didn’t deteriorate to that degree, and never surpassed 9% per Moody’s January 2021 report. Moody’s U.S. speculative-grade default rate stood at 8.3% in January 2021.
The outlook for defaults is decidedly better today than it was last March. Moody’s forecasting model shows a steady decline in the default rate over the next 12 months, falling to 5.6% by January 2022. While this decrease is a welcome improvement, the default rate remains high relative to the average default rate of 3.7% over the past 10 years and 4.5% over the past 25 years.
The energy sector
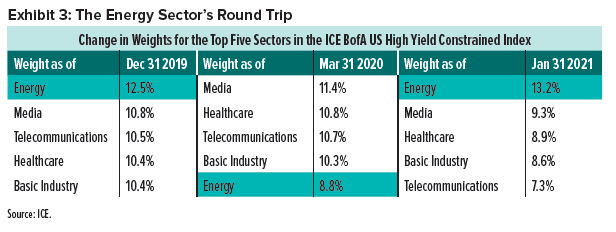
Energy has been a focal point of the high-yield market for quite some time. If an investor had stepped away from the market at the end of 2019 and came back today, the sector’s weight would not look much different, although its composition has changed.
The intervening period, however, was volatile. Energy began 2020 as high yield’s long-serving top sector, but then shrank to its fifth-largest sector by the end of the first quarter of 2020 after plunging by nearly 40%.
A wave of defaults, an influx of fallen angels, a pick-up in the new-issue market, and a nearly 55% return over the final three quarters of 2020 re-established energy as the largest sector in high yield. Despite this roundtrip, it is notable that energy was the only primary sector in negative territory for full-year 2020 (-6.55%).
SEI’s view
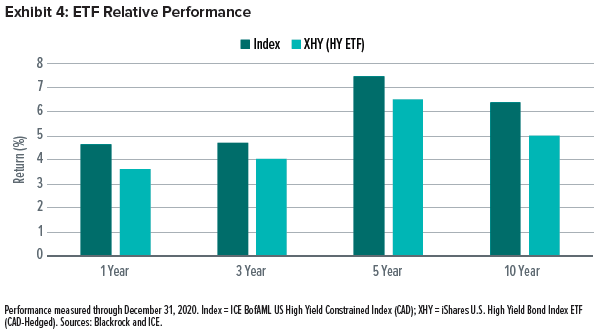
As the high-yield market hovers near all-time low yields, we believe active management and our manager-of-managers structure are essential to navigating a challenging environment for alpha generation. In our view, the passive approach has produced unimpressive results for long-term investors (Exhibit 4 on the next page).
Looking ahead, it will be important to avoid credit mistakes. Corporate default rates have continued to decline, but are expected to remain above historical averages. There should also continue to be positive opportunities for both rising stars (high-yield companies that are upgraded to investment-grade status) and acquisition candidates—two events that typically lead to outsized returns.
The energy sector—once again the largest within high yield—was the largest underweight in our strategy for a long time, but that is no longer the case. Our managers identified value in select sub-sectors and credits as energy underwent substantial turnover.
We believe the bank-loan market remains an enduring source of relative value. Furthermore, our manager-of-managers framework provides flexibility in balancing capacity constraints that larger single-manager strategies may struggle to offer.
Index Definitions
The ICE BofA US High Yield Constrained Index tracks the performance of below-investment grade, U.S. dollar-denominated corporate bonds publicly issued in the U.S. domestic market, but caps exposure to individual issuers at 2%.
Glossary of Financial Terms
Option-adjusted spreads estimate the difference in yield between a security or collection of securities and comparable Treasurys after removing the effects of any special features, such as provisions that allow an issuer to call a security before maturity.
Important Information
The information contained herein is for general and educational information purposes only and is not intended to constitute legal, tax, accounting, securities, research or investment advice regarding the Strategies or any security in particular, nor an opinion regarding the appropriateness of any investment. This information should not be construed as a recommendation to purchase or sell a security, derivative or futures contract. You should not act or rely on the information contained herein without obtaining specific legal, tax, accounting and investment advice from an investment professional. This material represents an assessment of the market environment at a specific point in time and is not intended to be a forecast of future events, or a guarantee of future results. There is no assurance as of the date of this material that the securities mentioned remain in or out of the SEI Strategies. Positioning and holdings are subject to change. All information as of February 18, 2021.
This material may contain “forward-looking information” (“FLI”). FLI is disclosure regarding possible events, conditions or results of operations that is based on assumptions about future economic conditions and courses of action. FLI is subject to a variety of risks, uncertainties and other factors that could cause actual results to differ materially from expectations as expressed or implied in this material. FLI reflects current expectations with respect to current events and is not a guarantee of future performance. Any FLI that may be included or incorporated by reference in this material is presented solely for the purpose of conveying current anticipated expectations and may not be appropriate for any other purposes.
Information contained herein that is based on external sources or other sources is believed to be reliable, but is not guaranteed by SEI, and the information may be incomplete or may change without notice. This document may not be reproduced, distributed to another party or used for any other purpose.
There are risks involved with investing, including loss of principal. Diversification may not protect against market risk. There may be other holdings which are not discussed that may have additional specific risks. Narrowly focused investments and smaller companies typically exhibit higher volatility. International investments may involve risk of capital loss from unfavourable fluctuation in currency values, from differences in generally accepted accounting principles or from economic or political instability in other nations. Emerging markets involve heightened risks related to the same factors, in addition to those associated with their relatively small size and lesser liquidity. Bonds will decrease in value as interest rates rise. High yield bonds involve greater risks of default or downgrade and are more volatile than investment grade securities, due to the speculative nature of their investments. SEI products may use derivative instruments such as futures, forwards, options, swaps, contracts for differences, credit derivatives, caps, floors and currency forward contracts. These instruments may be used for hedging purposes and/or investment purposes.
The value of an investment and any income from it can go down as well as up. Investors may get back less than the original amount invested. Returns may increase or decrease as a result of currency fluctuations. Past performance is not a reliable indicator of future results. Investment may not be suitable for everyone. If you should have any doubt whether it is suitable for you, you should obtain expert advice.
Index returns are for illustrative purposes only, and do not represent actual account performance. Index returns do not reflect any management fees, transaction costs or expenses. Indexes are unmanaged and one cannot invest directly in an index.
Not all strategies discussed may be available for your investment.
This material is not directed to any persons where (by reason of that person’s nationality, residence or otherwise) the publication or availability of this material is prohibited. Persons in respect of whom such prohibitions apply must not rely on this information in any respect whatsoever.
Information provided in Canada by SEI Investments Canada Company, the Manager of the SEI Funds in Canada. Commissions, trailing commissions, management fees and expenses all may be associated with mutual fund investments. Please read the prospectus before investing. Mutual funds are not guaranteed, their values change frequently and past performance may not be repeated.


