Economic Outlook: Back to Normal (Almost) (Long Version)
Canada has taken a more cautious and mostly unified approach to combatting COVID-19 compared to the U.S. response. This has been evident in the marked difference between the two countries’ reported infection rates throughout the pandemic. During the spike that hit Canada at the turn of the year, the country’s seven-day average of new cases reached a peak of 255 thousand—significantly less than U.S. high-point that averaged over 750 thousand new cases in a single week. In April, the tables were slightly turned as the Delta variant hit Canada hard, with a seven-day average of 233 thousand while the U.S. peak reading during the same period was 215 thousand.1 Canada’s slow start to vaccinate its population certainly had something to do with this shift, as did the arrival of warm weather south of the border that likely helped to moderate the U.S. infection rate. Now, however, at less than 20 cases, Canadians can begin to breathe a lot easier.
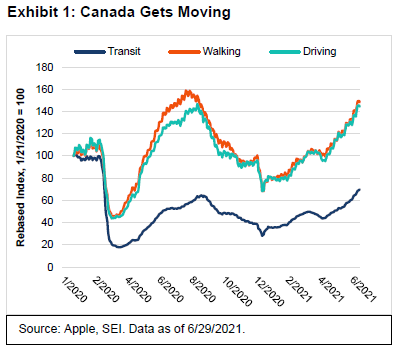
Mobility in Canada has improved considerably from the bleak days of winter, as we show in Exhibit 1. These numbers are not adjusted for seasonal ebbs and flows, so it’s better to compare today’s levels versus this time last year. On that basis, Canadians are now driving and walking at least 25% more; mobility for these two categories are about as high as the peaks reached last August, when warm weather helped to keep COVID-19 at bay. Transit usage, meanwhile, has soared 70% from its year-ago level, although it remains well below pre-pandemic ridership. Now that the vaccine distribution is proceeding rapidly, there is reason to hope the populace can return to normal life in the months immediately ahead.
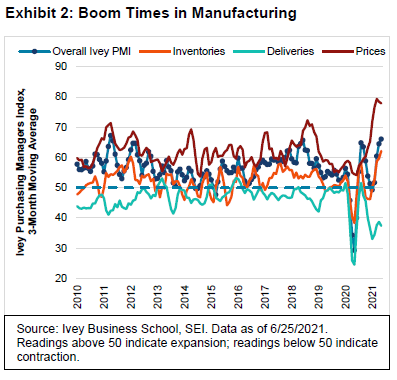
Parts of the economy have already returned to the “old normal,” notably in manufacturing and extractive industries. The three-month rolling average of the Ivey Purchasing Managers Index has staged a rapid comeback, as Exhibit 2 illustrates on the next page. Not only is it well above pre-pandemic levels in terms of the percentage of purchasing managers reporting improving business conditions, but it has reached highs seen only on a handful of occasions in the past 10 years. Looking at some of the index’s sub-components, the price index shows a remarkable near-80% of businesses reporting increases; at previous peaks, readings of 70% were the norm for this category. The other component of note is the deliveries index, which reveals the extreme difficulty businesses are having with filling orders; the only other recorded time that supply chains were more stressed was during the early stages of the pandemic last spring.
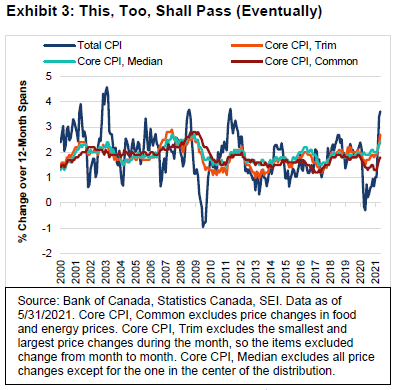
As is true in other developed markets, central bankers and economists have affirmed that these price pressures should prove transitory. The recent tumble in some commodity prices (notably lumber) give credence to this view. Exhibit 3 shows the various consumer-price measures tracked by the Bank of Canada (BOC). The total consumer-price index (CPI), which includes energy and food, has risen very sharply from depressed levels over the past year. However, measures of the core CPI, which excludes energy and food, are also rising. We suspect that price pressures will persist through the rest of the year and into 2022 as businesses that provide goods and/or services struggle to keep up with demand.
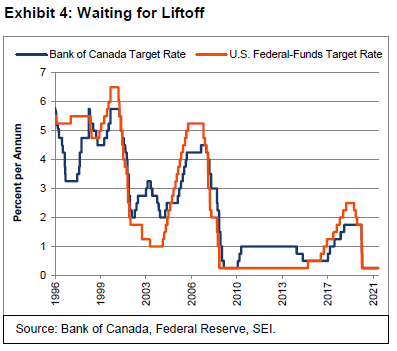
The BOC appears to be hedging its bets regarding inflation. It already announced a tapering of its security-purchase program (albeit after having become one of the most aggressive central banks through ramping up quantitative easing last year). The bank’s governing council also expects to raise its overnight policy rate in 2022, ahead of any move made by the U.S. Federal Reserve (Fed). Exhibit 4 compares the two central banks’ policy rates over time. While there have been divergences directionally (1996 to 1997, 2002 to 2004 and 2010 to 2015), the two countries’ overnight rates tend to sync up sooner or later. Even if the BOC appears more ready to hike rates than the Fed at the moment, we believe that both central banks will respond in similar fashion to arising trends in economic growth and inflation.
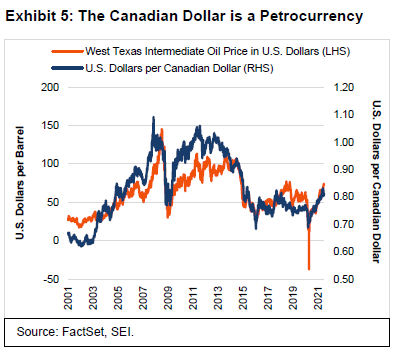
The Canadian dollar, meanwhile, has shown exceptional strength since hitting bottom in March 2020. As can be seen in Exhibit 5 on the following page, much of this strength is attributed to the commodities boom, especially in crude petroleum prices. However, a strong loonie against the U.S. dollar may be viewed as a double-edged sword. While it can help to moderate inflation by lowering the cost of imported goods from the U.S., it can also hurt Canada’s competitive position by increasing export costs to Canada’s most important customer. Given the Canadian dollar’s appeal as a commodity currency, we expect that it will continue to move higher in the near term until global growth rates normalize and the supply of raw materials moves into better alignment with demand.
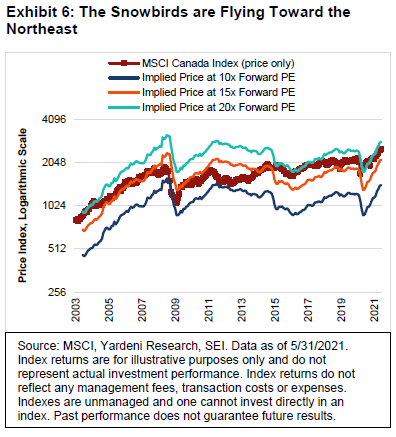
Currency concerns notwithstanding, a rebounding domestic and global economy combined with strong pricing power and a limited supply of raw materials is a great backdrop for risk assets—especially for Canadian equities. Exhibit 6 is adopted from a so-called Blue Angels chart (named for the U.S. Navy Blue Angels); it relates current stock prices, the trend in earnings, and the valuation of the market as measured by the MSCI Canada Index (price only). Since this is a chart focused on Canadian (rather than U.S.) equities, let’s rename it as The Snowbirds in honour of the 431 Canadian Forces Air Demonstration Team.
The parallel lines (the “contrails”) track the trajectory of security analysts’ 12-month forward earnings-per-share (EPS) estimates of the companies that make up the MSCI Canada Index. The EPS estimate is multiplied by different price-to-earnings (P/E) ratios (in this case, multiples of 10, 15 and 20) to get an implied price for the index. The line cutting through the contrails is the actual price index. The chart makes it easy to see at what multiple the MSCI Canada Index is trading at any point. Currently, it trades a bit below 20 times forward earnings.
Relative to history, Canadian equities are trading at a rather high multiple, but three factors should ease concerns about valuations. First, the earnings trend has been quite strong and should continue to head higher through 2021 and into 2022. Second, bond yields remain quite low, largely justifying (in our view) the high multiples sported by Canadian equities (not to mention most other stock markets globally). Finally, the price-to-earnings ratio applied to Canadian equities looks downright cheap versus the U.S.; on a relative P/E basis, the MSCI Canada Index in price-only terms trades at a 28% discount to the U.S. Over the past 10 and 18 years, that discount has averaged 11% and 8%, respectively.2
Good News is Still Good News
It was full-steam ahead for both the global economic recovery and the worldwide rally in risk assets (equities, commodities, high-yield bonds, real estate, and currencies). Even a recent stumble stemming from an apparent shift in the U.S. Federal Reserve’s expectations about interest-rate policy moves proved short-lived.
To be sure, COVID-19 is still wreaking havoc in parts of the world. As we entered the second half of the year, Latin America remained the epicentre of the disease with an infection rate that nearly doubled since December; several south Asian countries experienced flare-ups that outpaced their earlier episodes; and Australia and Israel re-imposed some restrictions to counter sharp surges in infection rates.
Despite these discouraging developments, the total number of new cases, hospitalizations and deaths have decreased significantly due to the ramp-up in vaccinations across North America and Europe, the seasonal shift to warmer weather in the northern hemisphere, and the ongoing lockdowns in harder-hit countries and regions.
Exhibit 7 highlights the progress the world has made in fighting the virus since the end of last year, tracked by the percentage change in the biweekly average of cases and deaths per million across the world’s most populous continents. In Asia, even as the number of cases per million jumped by 62% since December 2020, its biweekly average level remained below the (much-improved) readings in Europe and North America.
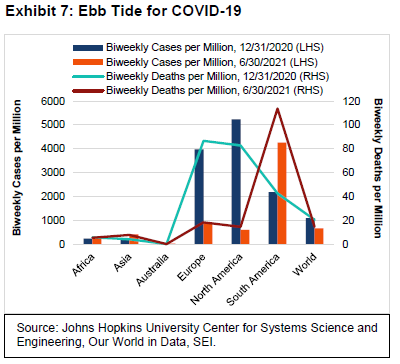
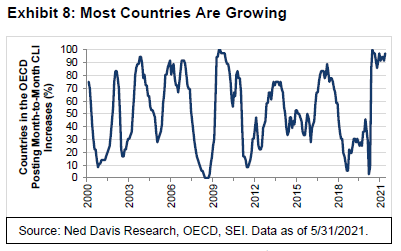
Exhibit 8 charts the percentage of countries with economies that are growing above trend (or should soon be), as measured by the Organisation for Economic Co-operation and Development’s (OECD) composite of leading indicators (CLIs), a metric which includes economic data related to the economic conditions that can influence consumer spending and business investment. Over two-thirds of the countries for which the OECD calculates CLIs are currently in this category, with their most recent readings exceeding 100. In May, all but one of those countries had been posting month-to-month gains, pointing to additional near-term acceleration in global economic activity. Countries like Brazil and India are struggling to contain the virus but are nevertheless showing signs of economic recovery.
Equity markets have long anticipated the economic improvement we now are seeing. Exhibit 9 is an update to a chart we included in last quarter’s Economic Outlook that compares the total returns of the MSCI USA Index, the MSCI World ex USA Index, and the five largest country indexes within the MSCI World ex USA. In the latest quarter, performance was rather uniform across the major developed-country indexes, with total returns mostly ranging from 4% to 9%. Japan was the major exception, with its MSCI benchmark gaining only 0.2%
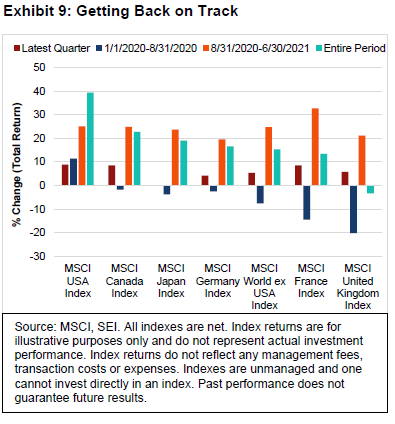
Since the end of August 2020, when financial and cyclical stocks began to outperform growth-oriented sectors, all but one of the indexes represented in the chart have exceeded 20% in cumulative returns. Germany just missed, with a 19.6% return. Aside from the MSCI United Kingdom Index, all now exceed the total-return levels that prevailed prior to the pandemic at the end of 2019.
This stellar performance, however, is beginning to make some market observers nervous. Cyclical stocks, financials and commodity prices pulled back sharply in the days following the mid-June U.S. Federal Reserve (Fed) policy meeting. There is increasing concern that equity prices have risen so much that there is little appreciation potential left, even if the global economy continues to forge ahead into 2022.
Investor expectations do appear to be catching up with the U.S. economy’s performance. Exhibit 10 tracks Citigroup’s economic surprise index for developed and emerging economies, as well as for the U.S. individually. “Peak surprise” for the U.S. and other developed markets generally came in August 2020. Weekly readings have since remained positive (suggesting that economic releases have, on balance, been beating expectations), but their strength has faded. The U.S. is getting closer to the zero mark, although other developed countries still appear to be surpassing forecasts at a decent pace. Emerging economies also seem to be generating positive data surprises on a consistent basis. At SEI, this is one reason why we believe international equity markets have the potential to outperform the U.S. as their economies continue to rebound in the months ahead.
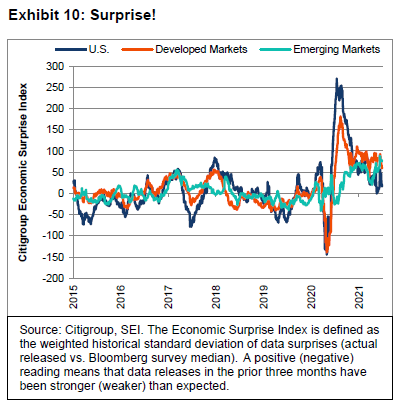
The big question likely nagging at investors: Does peak surprise also imply peak stock prices? Our answer is that no, it does not. However, we can’t rule out a choppier and more lacklustre performance for U.S. equities in the coming months—given their elevated valuations relative to most other stock markets around the world and their strong outperformance in total-return terms since the start of the secular bull market in March 2009. It is worth remembering that U.S. equities have scored consistent gains with nary a correction since March 2020. This is rather unusual. According to data provided by Ned Davis Research as of June 2021, the S&P 500 Index has not had a correction of 5% or more in the past 167 trading days or a correction of 10% or more in the past 322 trading days (since the market bottomed on a closing basis March 23 of last year).
Historically, stock-market corrections of 5% to 10% have been quite common in the S&P 500 Index and its predecessor benchmark indexes that go back to 1928. The average number of consecutive trading days without such a pullback is just 51, while the average number of days without a 10% correction works out to be 172. In our view, the moral of the story is that it’s best not to be overly concerned when volatility increases in equity markets.
We are fond of saying that a 5%-to-10% correction can occur “just because,” as there need not be any fundamental reason behind the decline. A sharper drop in prices does usually have some connection to a fundamental event that causes expectations to shift more substantially. Nonetheless, if the longer-term trend is positive, we would view such a decline as a buying opportunity for stock-market traders with shorter time horizons. As we saw last year, even a big stock-price decline that qualifies as a bear market can be surprisingly short. In today’s environment, with economies around the world opening up and interest rates hovering at extraordinary low levels, the dominant trend signals further price gains over the next year or two.
Still, investors would be wise to consider that the U.S. economy is not only well past “peak surprise,” but also appears to have reached “peak growth.” While it will likely continue to grow in excess of its long-term average for a few more quarters, the growth rate in overall inflation-adjusted gross domestic product (GDP) is expected to slow dramatically as the nation’s economy fully reopens. Exhibit 11 highlights the correlation between the Institute for Supply Management’s (ISM) purchasing managers’ index (PMI) for the manufacturing sector (ISM-M) and the relative performance of the S&P 500 Index (total return) versus the Bloomberg Barclays US Aggregate Bond Index (total return).
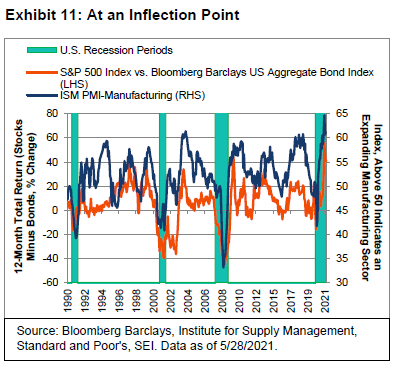
While the ISM-M achieved its peak reading in March, it remains above 60—a level that is seldom reached by this indicator of economic health. We expect it will stay well above the 50 line even as it continues to fade in the months ahead, pointing to further expected gains in the manufacturing sector. However, history shows that as the ISM-M declines, the degree of stock-market outperformance versus bonds ebbs as well. The closer the ISM-M gets to 50 (readings below 50 indicate contraction in the manufacturing sector and sluggish overall business activity), the greater the odds that stocks will lag bonds over a 12-month span. Note that growth slowdowns, not just recessions, can lead to equity underperformance versus bonds. During the 2009-to-2019 U.S. economic expansion, bonds delivered better relative performance for three different 12-month periods (2012, 2016 and 2019).
The performance of equites versus bonds was obviously phenomenal over the past 15 months; a major narrowing of the performance gap is inevitable. Yet, with interest rates still at exceptionally low levels (in both nominal and inflation-adjusted terms), it is hard to see equities losing ground to fixed-income securities while economic growth remains so robust. Not only should consumer demand remain strong as the economy opens up, but businesses, are expected to be in a spending mood too as they desperately seek materials and workers.
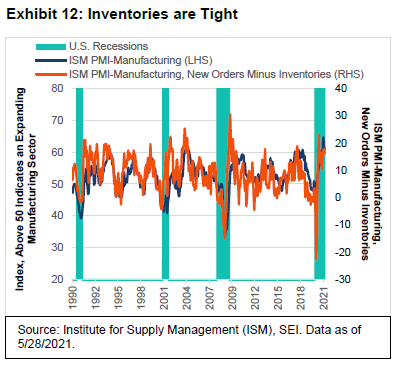
Exhibit 12 tracks the overall manufacturing sector against the difference between two of its components: new orders and inventories. It should come as no surprise that new orders are far outpacing inventories. The difference between the two components is historically consistent with today’s ISM-M of 60. Although the shortages and supply-chain disruptions will eventually be resolved, we expect it will take months to happen.
In the meantime, U.S. companies in many industries and of all sizes will enjoy a great deal of pricing power and will almost certainly pass along at least a portion of their increased costs onto their customers.
Unfortunately, one person’s pricing power is another person’s inflation. The big question is whether the price pressures seen this year are transitory, as the U.S. Fed and other central bankers around the world say they are. In the latest economic projections from the U.S. Fed, the Federal Open Market Committee (FOMC) sharply raised its median forecast for its preferred measure of inflation (the personal-consumption expenditures (PCE) price index, excluding food and energy) to 3.0% from 2.2% just three months ago. Yet the FOMC’s inflation forecasts for 2022 and 2023 were barely changed from the median reading for both at 2.1%.
Investors in the bond market seem to agree with the Fed’s point of view. Although U.S. bond yields rose sharply in the first quarter, they have fallen over the past three months. The 10-year U.S. Treasury bond currently trades below 1.50%, a noticeable decline of about 0.25% since the end of March. However, if inflation continues to accelerate at the fastest pace in almost 30 years, we believe that there might be no telling how long bond investors will maintain such a calm perspective.
Exhibit 13 suggests that the patience of bond investors could be tested for quite some time. The chart highlights the year-on-year change in the headline Personal Consumption Expenditures (PCE) price index (which includes the more volatile food and energy components). The vertical bars on the chart represent a statistic developed by the St. Louis Fed called the price-pressures measure (PPM). It calculates the probability at 70% or more that PCE inflation will exceed 2.5%, on average, over the next 12 months (the Fed’s long-term inflation target is set at 2%).
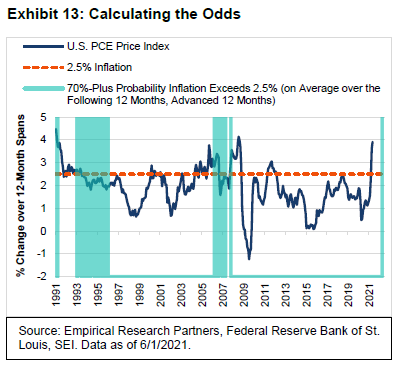
When charting the PPM, we advanced the series by 12-months in order to see how calculated probabilities have lined up with actual inflation reported one year later. This revealed that at the 70% probability level, actual inflation undershot the 2.5% mark for much of the period from 1993 to 1996. Between 2005 and 2008, on the other hand, PCE inflation spent a good amount of time above 2.5%—even during those intermittent periods when the probability level fell below 70%. Most recently, the PPM at the end of June 2021 showed a substantial 83% probability of inflation surpassing 2.5% one year later. Given the widespread prevalence of price inflation currently, we would not be surprised to see a string of PPM readings that exceed the 70% probability threshold for several more months.
If higher inflation becomes more deeply embedded than is currently anticipated by the U.S. Fed and investors, it will most likely be the result of strong and persistent labour-cost pressures. In Exhibit 14, we look at the U.S. Department of Labour’s employment cost index (ECI) and compare it to the ratio of job openings to unemployed persons (including individuals who are actively looking for work and those who desire a job but are not actively searching for one). Prior to the pandemic, both joblessness and unemployment were at historically high levels. In fact, in the two years leading up to the pandemic, there were more jobs available than there were officially unemployed persons. Labour costs rose above 3% in the one-year period ending March 2020—its largest year-over-year increase since the third quarter of 2008. The ECI decelerated sharply as the U.S. economy went into hibernation in the face of COVID-19 but has since rebounded modestly.
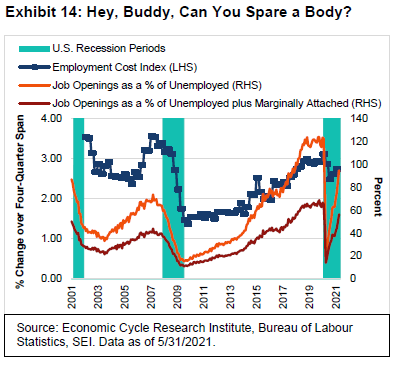
Job openings in the U.S. are now soaring. Once again, the U.S. economy is approaching the point of having nearly the same number of available jobs as there are officially unemployed persons—with the ratio quickly moving toward a previous high, even when including so-called marginally attached workers (those who desire a job but have not searched for employment in the prior four weeks). We expect labour-force participation to rise in the months ahead, but we also suspect that the labour market will nonetheless tighten further. If the rise in ECI accelerates as we expect, inflation could become a greater concern for investors than it appears to be at the moment.
Jobs can go begging to be filled for any number of reasons, even when there are many unemployed people. Positions may require skills that the currently unemployed do not possess, or they could be located in places where the unemployed are unwilling to go. Neither of these possible reasons seem to apply broadly in the current environment. Rather, enhanced unemployment benefits have served as a disincentive to settle for a job that pays the same or less, especially for workers at the lower end of the income scale. Twenty-six states have moved to halt these benefits before their early-September 2021 expiration. Beyond that, families, especially women, have been forced to forego paid work due to a lack of support for workers with children at home for remote learning. According to the U.S. Bureau of Labour Statistics, the civilian labour-force participation rate for females aged 25 to 54, has fallen 1.9 percentage points since December 2019 to 75% as of May. The comparable reading for males is 1.3 percentage points lower at 87.8%.
At SEI, we assume that the impediments and disincentives that have limited the supply of labour will ease considerably in the months ahead. A greater percentage of the population will be vaccinated, students will likely be physically back at school full-time in September and enhanced unemployment benefits will have expired. We will keep a close watch on the trends in labour compensation and productivity growth in judging how transitory inflation proves to be.
In his latest testimony, Fed Chairman Jerome Powell reiterated that the labour market still has a long way to go before it reaches full employment. Although FOMC members have finally started talking about tapering the Fed’s asset purchases, the central bank is expected to hold off from announcing anything official until late in the third quarter—with actual tapering beginning in the first quarter of 2022, at the earliest.
We expect the Fed to remain cautious when it comes to tightening the monetary reins. Although seven of the 18 Fed governors and regional presidents have pencilled in at least one policy-rate increase for 2022, we think such a move remains highly unlikely. To our surprise, markets reacted negatively to the central bank’s June 16 announcement about the FOMC’s updated “dot plot” of projections for the federal-funds rate. With this revision, the median FOMC projection now calls for two rate hikes in 2023—which was exactly what futures traders had already priced in prior to the mid-June announcement. Those same traders have now priced in three rate hikes by the end of 2023. While the Fed’s revised view of its timing for the first policy-rate increase is notable, it pays to remember that the actual increase is still far into the future. A lot can happen between now and the end of 2023.
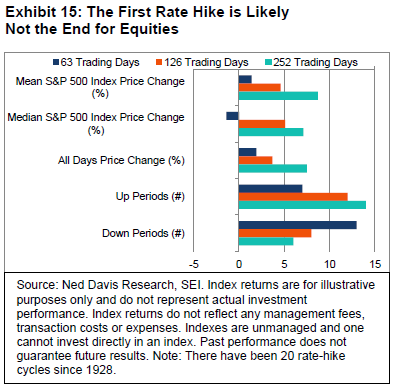
How will the equity market respond when the Fed does finally get around to raising its policy rate? It probably will still go up, if history is a guide. Exhibit 15 highlights the 20 occasions since 1928 when the Fed raised its policy rate (using the discount rate prior to 1987 and the federal-funds rate thereafter).
To date, the S&P 500 Index has managed to post a price-only gain over each 6- and 12-month period that followed a policy-rate hike exceeding the average historical increase. Of course, all rate cycles are unique, and investor sentiment can at times change dramatically. We only want to emphasize that equity bull markets can be resilient beasts. There may be a stumble when the U.S. central bank begins a rate-tightening cycle, but it typically takes significantly more tightening to kill the beast.
At this point, the Fed is much more focused on the labour market than the inflation rate. It may begin to taper purchases of mortgage-backed securities next year, but there’s a good possibility the central bank will continue to buy Treasurys at the current pace at least until the economy is operating much closer to full employment. Between the Fed’s near-zero interest-rate policy and its Treasury purchases, there seems to be little chance that longer-term bond yields will provide a positive inflation-adjusted return anytime soon—even as the Federal deficit continues to expand at a pace that would have stoked bond-market worries in years past.
To repeat, there is a strong expectation among investors that inflation will fall back to the Fed’s 2% long-term target next year. There also is little concern that the fiscal measures being pushed by President Joe Biden’s administration will cause the U.S. economy to overheat. Exhibit 16 highlights the Congressional Budget Office’s (CBO) projections of U.S. federal government receipts and expenditures as a percentage of GDP over the next 10 years. The solid lines represent the CBO’s baseline projections, while the dotted lines reflect the Biden administration’s spending and tax proposals (including the infrastructure plan currently being negotiated).
Although government outlays as a percentage of GDP will decline as emergency COVID-19 relief provisions expire, they are expected to remain around a 24% share of the total U.S. economy through the forecast period if Biden’s plan is passed in its entirety. That would match the high point briefly reached in 2009 following the global financial crisis, which included the worst recession in the post-World War II period prior to last year’s pandemic-related contraction. There is no recession forecast by the CBO between now and 2030. In other words, the federal government’s share of spending in the economy is forecast to rise on a permanent basis. On the revenue side, President Biden has proposed a sharp increase in taxes on corporations and high-income individuals, which would bring total receipts as a percentage of GDP up to 20%. The only time it reached these levels in recent history was in 2000, when economic activity was strong and the tech bubble helped to generate a temporary surge in capital gains. In that earlier period, soaring tax revenue and a cyclical decline in expenditures produced a rare surplus in the U.S. government’s fiscal position.
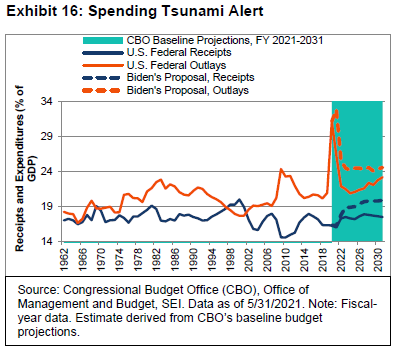
There is no surplus in sight, according to the CBO. Under the Biden plan, the deficit would average about 5% of GDP between 2023 and 2030 and could well end up being higher. Republicans may succeed in limiting tax increases, but the Democrats seem eager to push their spending priorities through the Senate’s reconciliation process on a party-line vote. It is possible, that spending will be limited at the insistence of one or two Democrats in the Senate. The future trend in fiscal policy should be much clearer before the end of September.
The combination of above-average economic growth; significantly higher inflation than seen in the past decade (let’s call it “persistently transitory”); a fiscal policy that expands the size of federal government spending as a proportion of GDP; and extreme monetary ease aimed at suppressing interest rates creates the perfect backdrop for risk assets—and for the birth of speculative bubbles.
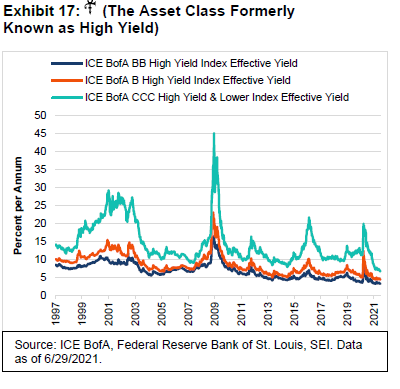
While not a bubble per se, we would note that even the riskier end of the fixed-income market has rallied to an extent that few would have ever imagined. Exhibit 17 shows that BB, B and CCC rated companies are all trading at their lowest yields ever. Yes, the fundamentals are incredibly good at the moment, but even the most hard-pressed companies in COVID-19-ravaged industries (cruise lines, hotels and airlines) have been able to refinance at low rates and extend the maturities on their debt. Yet it is unnerving to see the effective yield on BB rated debt at only 3.2%. Even more breathtaking is the 6.7% yield on speculative CCC securities. In April 2020, the effective yield touched 20%; at the height of the global financial crisis in 2008, the yield peaked at 45%.
GDP growth goes global
The relative success of the vaccination effort in the U.S. along with the country’s federal system of governance giving individual states the freedom to pursue COVID-fighting restrictions to varying degrees—from extremely restrictive to no restrictions at all—have resulted in a significantly stronger economy in 2021 relative to other major developed countries.
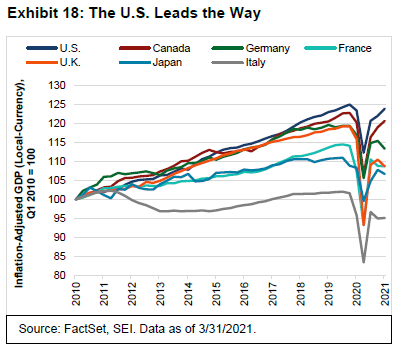
Exhibit 18 compares the path of inflation-adjusted GDP across a selection of major economies through the first quarter of 2021. In recent years, the U.S. and Canada have pulled away from the next two best performers (Germany and the U.K.)—with the U.S. having led the way since the end of 2019, followed by Canada and Japan. By March this year, U.S. inflation-adjusted GDP was only 0.9% away from its December 2019 level. When all economic datasets are in for the second quarter of 2021, we expect overall business activity in the U.S. to hit a new record high.
Meanwhile, Canada and Japan fell 1.7% and 2% short of their respective 2019 levels in the first quarter. France and Germany, by contrast, were down by 5%, while overall business activity in Italy and the U.K. were off by a substantial 6.4% and 8.7%, respectively, during the same period. Note that Japan and Europe contracted in the first quarter owing to their more restrictive lockdowns.
Fortunately, vaccinations are accelerating in Europe and Japan, and COVID-19-related lockdowns are becoming less restrictive. The Delta variant3 of the virus continues to challenge economic progress, but these countries are nevertheless expected to record solid increases in second-quarter GDP (albeit not as strong as the gain expected in the U.S.). We anticipate that other advanced economies will record strong results in the second half of 2021 and into 2022, exceeding the U.S. pace of growth. Canada and Japan should attain their previous peaks in real GDP later this year, while Germany and France will likely do so in the first half of 2022. While the U.K. and Italy are expected to take longer to reach their 2019 levels given their deeper recessions, both have the potential to enjoy sharper-than-average rebounds as the U.K. adjusts more fully to life after Brexit and Italy opens up to foreign tourism.
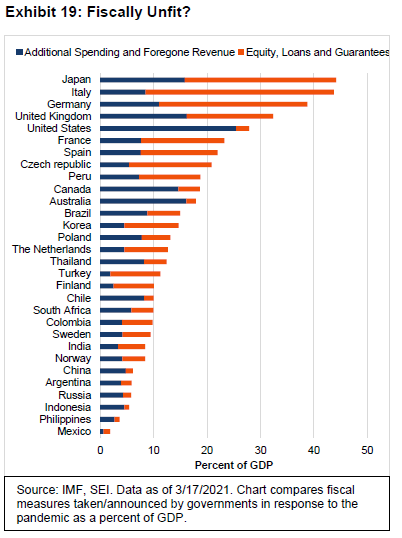
Although economists correctly point out that the U.S. has employed direct fiscal measures (emergency spending, income support and tax breaks) more aggressively than elsewhere in the world, other countries have used different tactics including loans, equity infusions and various guarantees that far exceed the U.S. fiscal effort. Exhibit 19 highlights the findings of the International Monetary Fund.4 Since the start of the pandemic response, the U.S. has provided direct fiscal support amounting to some 20% of 2020 GDP. Australia, the U.K., Japan and Canada have contributed the equivalent of roughly 15% to 16% of GDP. Most other countries lag far behind.
When one takes into account measures taken outside of direct fiscal support, the picture changes dramatically. Several European nations and Japan have relied on equity injections, loans and guarantees. The most notable are Italy (35% of GDP), Japan and Germany (both at 28%). In the eurozone, some of these loan commitments are only just beginning to flow. Italy and Spain are big beneficiaries of the eurozone’s €750 billion loans and grants that are part of the so-called NextGenerationEU program. The goal of the program itself is to fund research and innovation that helps Europe transition to a digital and greener economy, improve its healthcare and emergency preparedness, and reinforce initiatives that promote social and economic equality.
If anything good for Europe comes out of the pandemic crisis, it is the realization that an early return to economic austerity would have made matters much worse for the EU and eurozone. Policy makers remember all too well how the pressure to rein in deficits in the aftermath of the 2007-to-2009 global financial crisis led to the 2011-to-2013 sovereign debt crisis among the periphery countries of Europe. Even Germany has crossed the proverbial Rubicon, away from austerity and into a level of fiscal support (for both itself and the rest of Europe) that would have been unthinkable less than two years ago.
The same can be said for monetary policy. The European Central Bank (ECB) seems pretty dedicated in maintaining its pandemic-related monetary support at least through March 2022. It would not be a surprise if the current monetary support is extended beyond that time frame, even if there is likely resistance from Germany and a few other inflation-phobic countries. The ECB recently pledged to increase its purchases of sovereign debt as part of the Pandemic Emergency Purchase Program. Exhibit 20 on the following page tracks the security purchases conducted by the largest central banks.
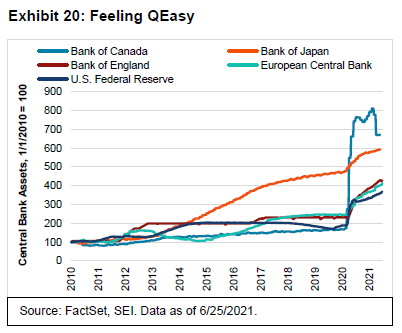
All in all, the ECB’s quantitative-easing program since the start of the pandemic seems mostly in line with the other central banks represented in the chart. The glaring exception is the Bank of Canada’s surge in purchases (from an exceptionally low base when measured against the size of its economy), although its bond portfolio has been pared significantly since February.
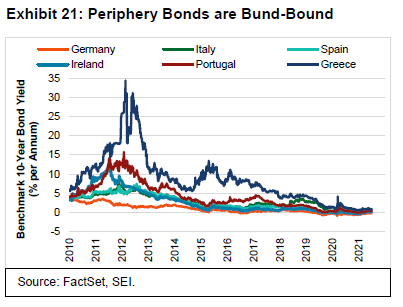
As a percentage of GDP, the ECB’s balance sheet has risen more than 25 percentage points since the beginning of the COVID-19 crisis. This compares with a rise in assets of 18 percentage points held by the U.S. Fed; a 19 percentage-point expansion in the Bank of England’s gilt portfolio; an increase of 30 percentage points reported by the Bank of Japan (BOJ); and a 15 percentage-point gain for the Bank of Canada. Exhibit 21 shows how successful the ECB policy has been in conjunction with its pandemic fiscal support. The peripheral countries’ 10-year sovereign bond yields have stayed well-behaved through the crisis period, retreating sharply from the March 2020 panic highs. They now are well below the levels that prevailed at the start of 2019.
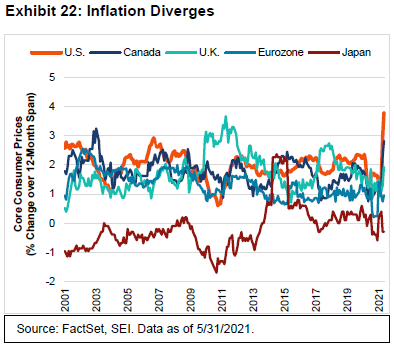
The world’s central banks are also singing from the same hymnal when it comes to inflation. Although consumer prices have accelerated in most of the countries/regions tracked in Exhibit 22, policymakers insist that it is a temporary event associated with the demand surge and supply-chain issues stemming from the re-opening of economies. While the U.S., the U.K. and Canada seem to be enduring a much sharper price rise than Japan or the eurozone, the latter two are probably relieved to have a respite from the deflationary pressures that have been afflicting their economies for many years. There seems little reason for the ECB or the BOJ to join the Fed when it comes to discussing a near-term reduction in their asset purchases, much less raising their policy rates ahead of the U.S.
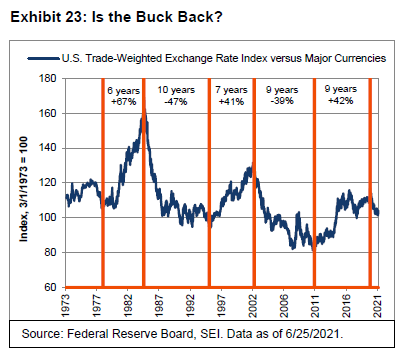
The trade-weighted U.S. dollar jumped to its best level in three months against other major currencies in the days following the Fed’s June announcement—yet the currency remains some 10% below its March 19, 2020 high, as we highlight in Exhibit 23 on the next page. Since any serious policy move by the Fed is still rather far into the future, we continue to expect the U.S. dollar to gradually weaken as the rest of the world gains economic strength. Longer term, the country’s deteriorating balance of trade and fiscal position could add to the downward pressure.
In the meantime, we also do not see much sign that the Fed’s shift toward an earlier lift-off in rates is leading to a 2013-style “taper tantrum” among emerging economies. Exhibit 24 tracks the currencies of a selection of emerging economies.
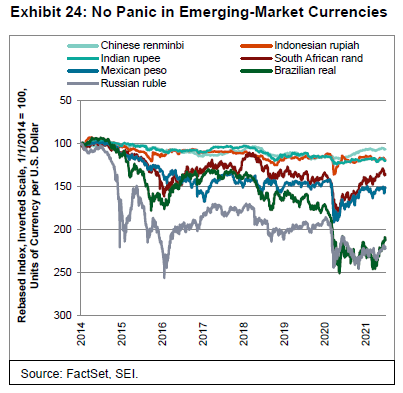
The Chinese renminbi, Indonesian rupiah, the Indian rupee, the Brazilian real and Russian ruble have all held firm against the U.S. dollar. The South African rand and Mexican peso have taken harder hits, but both remain well above their early 2020 lows. Mexico, Brazil and Russia have already taken preventative measures, raising policy rates in June to support their currencies and put a dent in their domestic inflation rates (Hungary and the Czech Republic, not shown in the chart, are two other developing countries to raise their policy rate in June). Other countries are likely to follow.
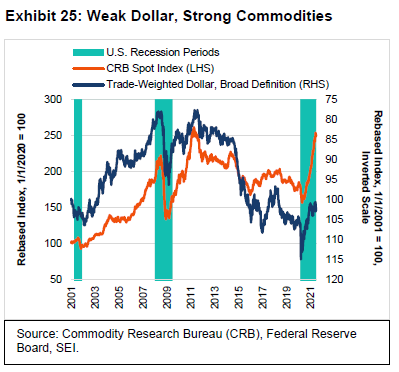
As Exhibit 25 shows, a strong U.S. dollar (which is plotted on an inverted scale in the chart) would certainly threaten the bull market in commodity prices. At SEI, we remain bullish on the outlook for commodities but are still watching price trends carefully. Commodity prices of all types have enjoyed a spectacular run since March 2020; lumber, gold, aluminium and copper were already in the process of consolidating/correcting in the weeks before the Fed revised its views. Industrial metals prices have also been hurt by the Chinese government’s intention to release supplies of copper. Offsetting these negatives are the ongoing demand/supply imbalances throughout the world, particularly for petroleum.
In previous reports, we highlighted how correlated both the U.S. dollar and commodity-price trends are in relation to developing-economy stock markets. Exhibit 26 on the following page breaks down the MSCI Emerging Markets Index (total return) into its broad regional components and tracks their performance from the start of 2020. In that time, the Asia component has enjoyed a cumulative gain of 35%—yet has gone basically nowhere since the beginning of this year, just prior to the onset of the COVID-19 pandemic. The MSCI EM Asia Index trades like a growth stock, which is not surprising since China, Taiwan, South Korea and India account for 94% of its weighting and are each heavily skewed toward technology.
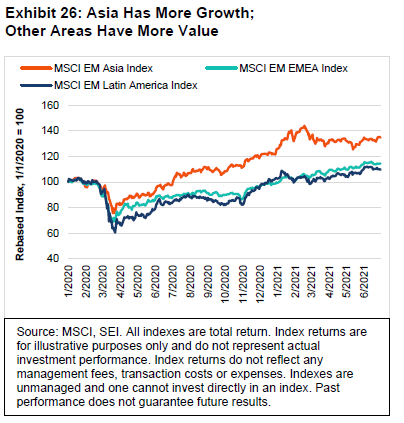
The other two components—MSCI EM Europe, Middle East and Africa (EMEA) Index (total return) and the MSCI EM Latin America Index (total return)—have performed much more in line with each other. Both fell sharply during the initial stages of the pandemic-related shutdown of the global economy, but have tended to outperform the MSCI EM Asia Index since November 2020. The EMEA and Latin America components are highly weighted toward financials, materials and energy, and have little exposure to less-cyclical, faster-growing sectors like technology, health care or communications. On a country-weighted basis, the MSCI EM EMEA Index is dominated by South Africa, Russia and Saudi Arabia (75% of its capitalization), while the MSCI EM Latin America Index is dominated by Brazil and Mexico (a combined weight of nearly 90%).
We remain optimistic that the more cyclical and value-oriented sectors and geographies will bounce back from their modest stumble in June. But there are near-term challenges besides the shift in perceptions about U.S. Fed policy and the future course of the U.S. dollar and commodity prices. The strength of China’s economy is in question too. Exhibit 27 underscores the fact that credit growth in that country has decelerated significantly, similar to the slowdowns recorded in 2013 and 2018—when the performance of emerging markets was less than stellar.
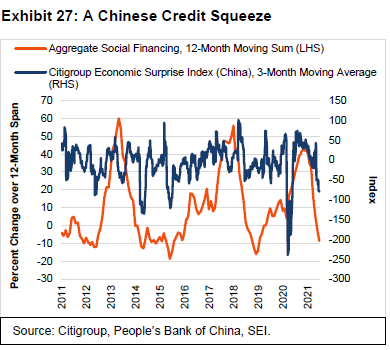
Economic surprises in China, meanwhile, have turned negative. We are counting on the advanced economies to take up the slack. As pointed out earlier, there is a tremendous amount of excess savings and pent-up demand in North America and Europe. Households and businesses have the wherewithal to spend lavishly through the rest of this year and into 2022, with the most important constraint being supply-chain issues and widespread shortages. As developing countries ramp up vaccination efforts, however, their economies should benefit from the surge in worldwide trading activity.
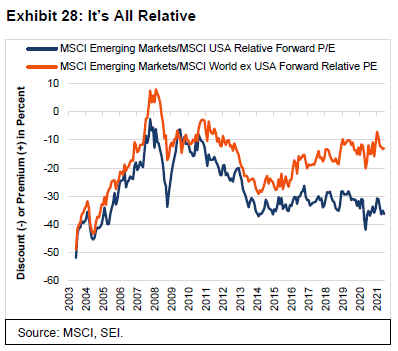
Emerging markets continue to look relatively cheap versus most other regions. Exhibit 28 on the next page shows that the forward price-to-earnings multiple of the MSCI Emerging Markets Index is still selling at a 36.4% discount to that of the MSCI USA Index as of June 30. Outside of the March-to-April 2020 pandemic low point, this is as cheap a relative multiple against the U.S. that has been seen at any time in the past 16 years. The valuation disparity is not quite as wide against the rest of the developed world (represented by the MSCI World ex USA Index), but the estimated long-term forward earnings-per-share growth rate of the companies that make up the MSCI Emerging Markets Index tends to be five percentage points higher per annum than those in the MSCI World ex USA Index.
The things to watch
The last several weeks have witnessed a partial unwinding of the rotation trade that began in early September and was turbocharged by last November’s blockbuster news regarding the COVID-19 vaccines’ efficacy and safety results. So far, this appears to be a temporary pause in a longer-term upswing. At SEI, we contend that the global recovery and expansion have a long ways to go, especially since many countries are still restricting free movement and commerce to at least some degree.
The COVID-19 variants are obviously a matter of concern, but the vaccines still appear to be quite effective once people are fully inoculated. Fortunately, vaccine production is ramping up and initial distribution snafus are being ironed out in the developed countries. By the end of the third quarter, the majority of people in North America and Europe should be fully protected; the most vulnerable (older) age groups are close to being fully protected already.5 The challenge may be to convince younger people to get the vaccine. Even if herd immunity is not achieved, the rate of hospitalizations and deaths are likely to be much lower as a proportion of new cases. That said, as the northern hemisphere enters autumn and winter, the possibility of regional spikes in infections cannot be dismissed. If severe enough, markets could switch back to a decidedly risk-off position.
At SEI, we remain focused on the near-term positives when it comes to COVID-19. Slowing vaccination rates in the developed world mean more shots become available for the rest of the world. That is why we expect a rolling reopening of the global economy that extends well into 2022. This wave of recovery, though, could resemble an extended up-cycle that keeps the pressure on supply chains, leading to continued shortages of goods and labour. Investors’ faith in the “transitory inflation” narrative probably will be tested as we begin to wrap up the year and move into 2022.
The recent stumble in the rotation theme was exacerbated by the U.S. Fed’s shift in expectations toward a sooner-than-forecast increase in the federal-funds rate. To some extent, the central bank’s changed outlook seems to represent nothing more than a communications problem. How can the Fed be more focused on actual outcomes than forecasts, yet provide guidance that is based on a prediction about future trends in economic growth and inflation a year or two from now? It is clear, however, that the Fed will begin to cautiously move away from its current policy stance. The first move will likely be the tapering of its bond-buying program, which may be announced at the end of August during the annual economic policy symposium in Jackson Hole, Wyoming.
The challenge of deciphering the path of U.S. fiscal policy is made even harder by the lack of bipartisanship in Washington, D.C. and the narrowness of the Democratic majority in both houses of Congress, but especially the Senate. A traditional infrastructure bill is a good bet, but the push for non-traditional forms of infrastructure—and the taxes to pay for all the added spending—will depend on whether the Democrats in the Senate can come to terms with each other. Investors also need to brace themselves for another fight over the debt ceiling coming in the August-to-October time frame. Raising the ceiling has been less of an issue in recent years, but that will not be the case this year. Some readers might remember the battle over the debt ceiling in August 2011; at the time, the threat of default and the downgrading of the U.S. government’s credit rating caused a steep decline in risk assets.
Internationally, central bankers in Canada and the U.K. are talking about tapering as well (the former country has already started to taper). The ECB is only at the talking-about-talking-about-it stage, but the debate in within the ECB could be fiercer than elsewhere given the divide between the rich inflation-phobic countries and the poorer countries that are more dependent on growth and government support.
Politics should also be lively in view of possible leadership changes that lay ahead. Germany will vote for a new Chancellor in September this year that will replace Angela Merkel, who has held the office since 2005. France begins its presidential election process in April 2022, with President Emmanuel Macron far less popular now than he was in 2017—perhaps giving an opening to candidates that are further to the left and the right on the political spectrum. Canada may also see a snap election before the end of this year, although one need not take place before the scheduled end of the legislature in October 2023.
Another potential source of market volatility could stem from China’s increasingly fraught relationship with the U.S. and its allies. Global tensions over Hong Kong, human rights, and, most worryingly, Taiwan, could continue to spill over from the political sphere into the economic sphere. The tariff war waged by former U.S. President Donald Trump yielded mixed results, at best. But if there is any consensus in Washington nowadays, it is focused on countering China’s growing economic and military strength. Investors have mostly managed to look past political tensions, so we do not want to over-emphasize the negatives. However, managing the relationship between the U.S. and China could become a key consideration in future years.
What actions are our portfolio managers taking?
In our domestic portfolios, the previous quarter was tough for our value-oriented managers; however, they have not changed their positioning and are still overweight the materials and financials sectors. Our momentum managers outperformed during the same period and benefitted from adding to their energy and consumer discretionary exposure.
Within our U.S. large-company portfolios, there was no major change in positioning during the second quarter. Quality and value-oriented stocks were still viewed as trading at attractive prices. Managers do not expect runaway inflation, nor are they buying inflation hedges; they have been positioning for a full reopening of the U.S. economy (which is correlated with the inflation trade). In terms of performance, it was a choppy quarter. While growth led, value did have a few good runs. There was some disciplined rebalancing as managers sorted through stocks that ran up too far during the recent rally. Managers favoured the financials, industrials and health care sectors. Mega-cap stocks were underweight, while large-caps were overweight.
In our U.S. small-company portfolios, higher-quality and low-volatility stocks were attractive from a valuation perspective during the second quarter. Managers favoured the financials and industrials sectors, while health care was out of favour. With two big meme stocks (GameStop and AMC) set to move out of small-cap indexes, volatility should decrease.
Within international equity markets, quality managers generally outperformed value and momentum managers for the three-month period ending June. Traditional defensive names were left behind in this pro-cyclical reflationary rally. We continued to make adjustments in support of our value tilt, with most changes having been around the edges; our portfolios modestly trimmed exposure to banks. Some managers have added to their materials allocations.
In Asia and emerging markets, performance was mixed for the second quarter as the resurgence of COVID-19 impacted many countries. Exporting nations saw favourable returns during the period, while domestic-oriented economies generally fared well. Taiwan, Vietnam and Korea all gained. Energy and telecommunications outperformed during the quarter, while small-cap stocks continued to beat large caps. High exposure to small-cap and frontier markets contributed to performance. We remain optimistic about the value trade. There were not many changes in terms of positioning during the period.
The Canadian yield curve did not change much during the last three months, although we saw a big swoon in rates, which are essentially back to where we were about two years ago. The most recent headline inflation figure came in at 3.6%; we are getting transitory inflation effects, mostly from commodities. We believe the Bank of Canada has become a huge player in the Canadian bond market and now has the ability to initiate yield-curve control. We are overweight corporate credit and underweight duration and spread duration.
The high-yield market was up for the quarter. Energy outperformed the broader market. The new-issuance market continued to be strong. Refinancing was still the key theme during the period. The default rate was close to 5.5%.
Emerging markets have been lagging developed markets. Managers view inflation as transitory and believe that base-effects will wear off. Short-term inflation could remain elevated. Hard currency and high yield continue to be attractive. We believe there is still room for growth, as many central banks have kept policy rates near or at all-time lows; even if central banks begin to tighten, policy rates will still be low enough to support growth.
Glossary
Bear market refers to a market environment In which prices are generally falling (or are expected to do so) and investor confidence is low.
Bull market refers to a market environment in which prices are generally rising (or are expected to do so) and investor confidence is high.
Congressional Budget Office’s (CBO) is a federal agency within the legislative branch of the United States government that provides budget and economic information to Congress.
Cyclical stocks or sectors are those whose performance is closely tied to the economic environment and business cycle. Managers with a pro-cyclical market view tend to favour stocks that are more sensitive to movements in the broad market and therefore tend to have more volatile performance.
Discount rate is the minimum interest rate set by the Federal Reserve for lending to other banks.
European Union (EU) is a group of 27 countries that operates as a cohesive economic and political block. Nineteen of the countries use the euro as their official currency.
Growth stocks exhibit steady earnings growth above that of the broader market.
High-yield bonds are rated below investment grade and are considered to be riskier.
International Monetary Fund (IMF) promotes international financial stability and monetary cooperation. It also facilitates international trade, promotes employment and sustainable economic growth, and helps to reduce global poverty. The IMF is governed by and accountable to its 190 member countries.
Issuance is the sale of securities, typically with regard to debt instruments such as bills, notes and bonds.
Price Pressures Measure (PPM) was developed by the Federal Reserve Bank of St. Louis to measure the probability that the expected personal-consumption expenditures price index inflation rate (12-month percent changes) over the next 12 months will exceed 2.5 percent. It is
composed of 104 separate data series grouped into nine different buckets: (1) consumer-price indexes, (2) producer-price indexes, (3) commodity prices, (4) housing and commercial property prices, (5) labour-market indicators, (6) financial variables, (7) inflation expectations, (8) business and consumer survey data, (9) foreign price variables
Price-to-earnings (P/E) ratio is the ratio for valuing a company that measures its current share price relative to its per-share earnings (EPS).
Quantitative easing (QE) is a form of unconventional monetary policy in which a central bank purchases longer-term securities from the open market in order to increase the money supply and encourage lending and investment.
Standard deviation refers to a formula used to calculate the historical volatility of performance.
Taper tantrum describes the 2013 surge in U.S. Treasury yields resulting from the Federal Reserve's announcement of future tapering of its quantitative-easing program.
Yield curves represent differences in yields across a range of maturities of bonds of the same issuer or credit rating (likelihood of default). A steeper yield curve represents a greater difference between the yields. A flatter curve indicates that yields are closer together.
Value stocks are those that are considered to be cheap and are trading for less than they are worth.
Index definitions
The Bloomberg Barclays EM Local Currency Government Index measures the performance of local-currency emerging-market sovereign debt.
The Bloomberg Barclays US Aggregate Bond Index is a market-value-weighted index consisting of investment-grade, fixed-rate debt issues (including government, corporate, asset-backed, and mortgage-backed securities), with maturities of at least one year.
The Citigroup Economic Surprise Index measures data surprises relative to market expectations. The index was designed for currency trading and its signals may not be relevant to other financial instruments. A positive (negative) reading means that data releases in the prior three
months have been stronger (weaker) than expected.
The Consumer Price Index measures changes in the price level of a weighted average market basket of consumer goods and services purchased by households. A consumer price index is a statistical estimate constructed using the prices of a sample of representative items whose prices are collected periodically.
The Commodity Research Bureau (CRB) Raw Industrial Commodity Price Index is a measure of price movements of 22 sensitive basic commodities whose markets are presumed to be among the first to be influenced by changes in economic conditions. It serves as one early indication of impending changes in business activity.
The Employment Cost Index is a quarterly economic series published by the Bureau of Labour Statistics that details the growth of total employee compensation. The index tracks movement in the cost of labour, as measured by wages and benefits, at all levels of a company.
The ICE BofA High Yield BB Index is a capitalization-weighted index of U.S. dollar-denominated below-investment-grade corporate debt rated BB and publicly issued in the U.S. domestic market.
The ICE BofA High Yield B Index is a capitalization-weighted index of U.S. dollar-denominated below-investment-grade corporate debt rated B and publicly issued in the U.S. domestic market.
The ICE BofA High Yield CCC Index is a capitalization-weighted index of U.S. dollar-denominated below-investment-grade corporate debt rated CCC and publicly issued in the U.S. domestic market.
The ISM Manufacturing Index is a monthly indicator of U.S. economic activity based on a survey of purchasing managers at more than 300 manufacturing firms. It is considered to be a key indicator of the state of the U.S. economy.
The Ivey Purchasing Managers Index is prepared by the Ivey Business School and is an economic index that measures the month-to-month variation in economic activity as indicated by a panel of purchasing managers from across Canada.
The MSCI Canada Index is designed to measure the performance of the large- and mid-cap segments of the Canada market. With 91 constituents, the Index covers approximately 85% of the free float-adjusted market capitalization in Canada.
The MSCI Emerging Markets Asia Index is designed to measure the performance of the large- and mid-cap segments across nine emerging-market countries in Asia.
The MSCI Emerging Markets Index is a free float-adjusted market-capitalization-weighted index designed to measure the performance of global emerging-market equities.
The MSCI Europe, Middle East and Africa Index is designed to measure the performance of large- and mid-cap stocks across 12 emerging markets countries in Europe, the Middle East and Africa (EMEA). With 163 constituents, the Index covers approximately 85% of the free float-adjusted market capitalization in each country.
The MSCI France Index is designed to measure the performance of large- and mid-cap stocks in France.
The MSCI Germany Index is designed to measure the performance of large- and mid-cap stocks in Germany.
The MSCI Japan Index is designed to measure the performance of large- and mid-cap stocks in Japan.
The MSCI Emerging Markets Latin America Index is designed to measure the performance of the large- and mid-cap segments across six emerging-market countries in Latin America.
The MSCI United Kingdom Index is a free float-adjusted market-capitalization-weighted index designed to measure the performance of large- and mid-capitalization stocks in the U.K.
The MSCI USA Index measures the performance of the large- and mid-cap segments of the U.S. market.
The MSCI World Index is a free float-adjusted market-capitalization-weighted index that is designed to measure the equity-market performance of developed markets.
The MSCI World ex USA Index is a free float-adjusted market-capitalization-weighted index that is designed to measure the equity-market performance of developed markets, excluding the U.S.
The Personal Consumption Expenditures (PCE) Price Index is the primary inflation index used by the Federal Reserve when making monetary policy decisions.
The S&P 500 Index is an unmanaged, market-weighted index that consists of 500 of the largest publicly traded U.S. companies and is considered representative of the broad U.S. stock market.
Important Information
SEI Investments Canada Company, a wholly owned subsidiary of SEI Investments Company, is the Manager of the SEI Funds in Canada.
The information contained herein is for general and educational information purposes only and is not intended to constitute legal, tax, accounting, securities, research or investment advice regarding the Funds or any security in particular, nor an opinion regarding the appropriateness of any investment. This commentary has been provided by SEI Investments Management Corporation (“SIMC”), a U.S. affiliate of SEI Investments Canada Company. SIMC is not registered in any capacity with any Canadian regulator, nor is the author, and the information contained herein is for general information purposes only and is not intended to constitute legal, tax, accounting, securities, or investment advice, nor an opinion regarding the appropriateness of any investment. You should not act or rely on the information contained herein without obtaining specific legal, tax, accounting and investment advice from qualified professionals. This information should not be construed as a recommendation to purchase or sell a security, derivative or futures contract. You should not act or rely on the information contained herein without obtaining specific legal, tax, accounting and investment advice from an investment professional. This material represents an assessment of the market environment at a specific point in time and is not intended to be a forecast of future events, or a guarantee of future results. There is no assurance as of the date of this material that the securities mentioned remain in or out of the SEI Funds.
This material may contain "forward-looking information" ("FLI") as such term is defined under applicable Canadian securities laws. FLI is disclosure regarding possible events, conditions or results of operations that is based on assumptions about future economic conditions and
courses of action. FLI is subject to a variety of risks, uncertainties and other factors that could cause actual results to differ materially from expectations as expressed or implied in this material. FLI reflects current expectations with respect to current events and is not a guarantee of future performance. Any FLI that may be included or incorporated by reference in this material is presented solely for the purpose of conveying current anticipated expectations and may not be appropriate for any other purposes.
There are risks involved with investing, including loss of principal. Diversification may not protect against market risk. There may be other holdings which are not discussed that may have additional specific risks. In addition to the normal risks associated with investing, international
investments may involve risk of capital loss from unfavourable fluctuation in currency values, from differences in generally accepted accounting principles or from economic or political instability in other nations. Emerging markets involve heightened risks related to the same factors, in addition to those associated with their relatively small size and lesser liquidity. Bonds and bond funds will decrease in value as interest rates rise.
Information contained herein that is based on external sources is believed to be reliable, but is not guaranteed by SEI Investments Canada Company, and the information may be incomplete or may change without notice.
Commissions, trailing commissions, management fees and expenses all may be associated with mutual fund investments. Please read the prospectus before investing. Mutual funds are not guaranteed, their values change frequently and past performance may not be repeated.


