Economic Outlook: Between the Waves
In the first 26 weeks of 2020, much of the world faced some of the most challenging crises of the past century in terms of public health concerns, economic upheaval and social unrest. The novel coronavirus, which causes the disease COVID-19, rapidly became one of the deadliest pandemics since the 1918 Spanish flu. Global efforts to slow the COVID-19 infection rate led to government-mandated economic shutdowns that rival the worst years of the Great Depression (1929-1933). The brutal killing of George Floyd, an American black man, by a white police officer in Minneapolis, Minnesota, sparked a wave of global outrage and protests.
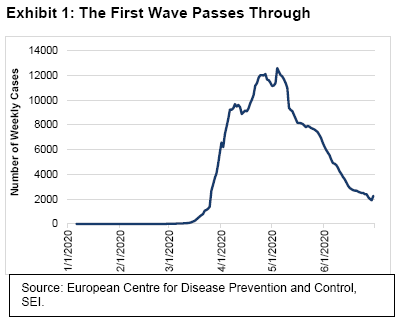
Against a bleak global backdrop, Canada has made progress against COVID-19. As Exhibit 1 shows, the number of new cases measured on a weekly basis has fallen from a peak of 12,590 during the week ended May 4 to a current reading of 2,270 as of June 29. That’s the lowest total in more than three months. The death rate is 23 per 100,000 population, which compares favourably to the U.S at 38. Quebec suffered the worst experience, recording a death rate of 65 per 100,000 population, followed by Ontario (18) and Nova Scotia (6).
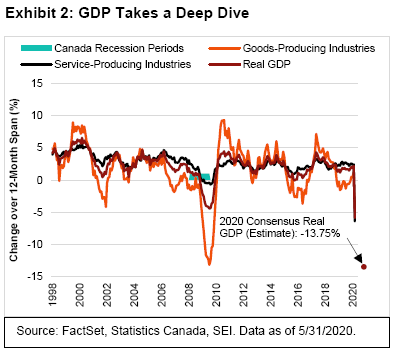
Although the human cost in terms of lives has been less than in the U.S. or in much of Europe, the economic impact has been just as devastating. Exhibit 2 is a display of monthly gross domestic product (GDP) measured on a year-over-year percentage-change basis. As of March, Canadian economic activity was 5.8% below the year-ago level. FactSet’s survey of consensus estimates for full year 2020 indicates a 13.95% decline, versus an estimate of -5.1% for the U.S. Service-producing industries recorded their worst-ever year-over-year plunge in March. Goods-producing industries also fell, but not nearly as much.
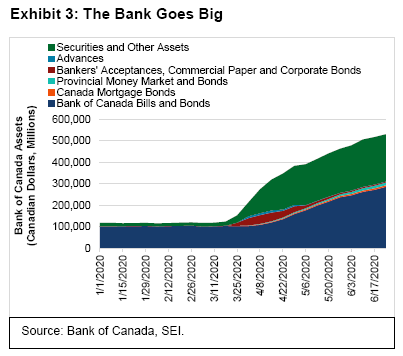
Like the Fed, the Bank of Canada (BOC) has employed a full arsenal of monetary-policy tools to combat the impact of the economic shutdown. It lowered the policy interest rate in March to 0.25% from 0.75%. It was 1.75% at the start of the year. It also launched a variety of large-scale asset purchase programs for mortgage bonds, commercial paper, bankers’ acceptances, corporate bonds and provincial and federal government debt. While the BOC was the least aggressive major central bank when it came to large-scale asset purchases following the end of the global financial crisis in 2009, it has become one of the most aggressive during the past six months, as seen in Exhibit 3.
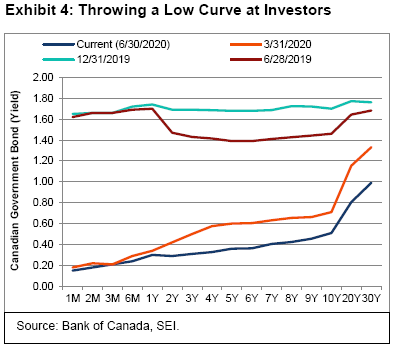
The Bank of Canada’s actions have caused the Treasury yield curve to fall dramatically across the board, as seen in Exhibit 4. Treasury bill rates have plummeted by more than 1.4 percentage points from year-end and year-ago levels. The middle part of the yield curve has fallen nearly as much (more than 1.3 percentage points since 12/31). The long end, meanwhile has registered yield declines of 1.2 percentage points for the 10 year maturity and more than 75 basis points for the 30-year. Although Fitch, a ratings agency, recently lowered Canada’s debt to AA+ from AAA, the deterioration in the country’s finances doesn’t seem any more severe than what is happening in other developed countries. Note that Standard & Poor’s cut the debt rating of the United States to AA+ in August 2011, with little lasting impact.
Investors Seek Shelter
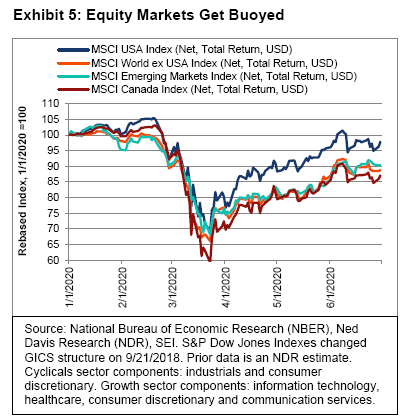
Investors initially responded to the government-induced plunge in global economic activity as one might expect: They rushed into full-blown “risk-off” mode. As Exhibit 5 illustrates, equity prices around the world fell sharply from their peaks during the first quarter (as measured by the MSCI USA, MSCI World ex USA and MSCI Emerging Markets Indexes). U.S. stock prices dropped most dramatically, plunging on March 23 from their February 19 peak by 33.4%— their steepest historical drop from a former high in such a short time span. However, despite the ever-rising number of pandemic-related infections, hospitalizations and deaths, and the subsequently stalled global economic activity, stock markets around the world have since managed to mount a resounding comeback by the end of June. The MSCI USA Index (net, total return) soared to finish the second quarter 41% higher than its March 23 low, and was down just 2.2% for the year to date. While the MSCI World ex USA and MSCI Emerging Markets Indexes continued to lag their U.S. counterpart, they each finished the second quarter remarkably higher than their respective March lows; for the year to date, they both fell by approximately 10% in U.S. dollar terms.
Three months ago, we suggested that there could be a major change in stock-market leadership. Since valuation dispersions between U.S. growth and value stocks (the differential between the top quintile of stocks in terms of valuation versus the market average) were at their widest level since the global financial crisis of 20081, SEI’s equity managers strongly believed that their bias toward value (and away from the largest technology-oriented stocks sporting the highest price-to-earnings ratios and market capitalizations) would prove beneficial in the months ahead.
Exhibit 6 is an updated version of a chart we highlighted last quarter that illustrates the relative strength of traditional cyclical stocks (the industrials and consumer discretionary sectors) versus the growth sectors (information technology, healthcare, consumer discretionary and communication services), as defined by Ned Davis Research. As we noted last quarter, a rotation into value usually occurs in the midst of a recessionary period; although the relative performance of cyclical stocks (which tends to be closely tied to the economy) sometimes worsens dramatically just before that turn comes. As investors focus on early signs of a business-cycle turn, they could switch gears quickly. The relative performance of cyclical stocks has improved since mid-May, but they still have a lot of ground to recover.
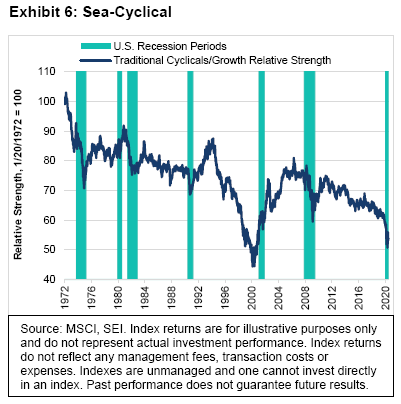
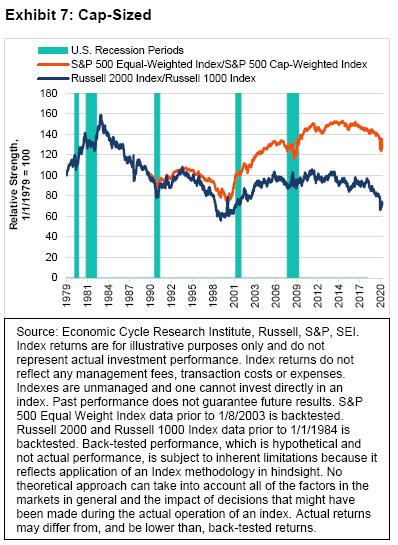
Exhibit 7 extends this analysis beyond a cyclical-versus-growth comparison to chart the relative strength between capitalization sizes and index weighting methodologies over a period of more than 40 years through June 2020. The blue line represents the performance of small-capitalization stocks (as measured by the Russell 2000 Index, total-returns) versus large-capitalization stocks (as measured by the Russell 1000 Index, total returns), while the orange line represents the relative performance of the equal-weighted S&P 500 Index versus its market-cap-weighted counterpart. Both relative-performance lines show a pattern similar to that of the cyclical-versus-growth performance illustrated in Exhibit 2. This is to say that relative performance in market-capitalization terms has also improved off the March lows—yet remains below January-to-February levels and declined on the return of COVID-19-related concerns toward the end of the second quarter. In the past, cyclical outperformance has tended to persist for at least a year or two upon the arrival of a business-cycle turn. Although past performance is not a guarantee of future results, we expect history to repeat itself; should global economic growth continue to recover from the April-to-May trough, we believe value/cyclical stocks will outperform growth, while smaller companies will likely outperform larger companies.
A second wave on the horizon
Unique challenges lie ahead, however. Although equities have exhibited a consistent pattern of behaviours related to market-leadership changes and economic-regime shifts, there is always the chance that things will be different this time. First and foremost, COVID-19 is not going to magically disappear. We assume there will likely be another significant wave of infections as the Northern Hemisphere enters the fall-to-winter flu season. The question is, how disruptive will it be to the global economy?
Although there are well-placed hopes that a vaccine and effective therapeutics will eventually become available, it seems unlikely that production will ramp up quickly enough to benefit most of the world’s general population No nation in the world has achieved broad levels of virus immunity. Even in one of the worst-hit parts of the world—the so-called tri-state area of the U.S. that comprises New York, New Jersey and Connecticut—it was estimated that just 20% to 30% of the population developed antibodies against the coronavirus that causes COVID-19 as the end of June approached. Recent studies showed that major cities in other areas of the world achieved an infection rate of between 7% and 17%. London was at the high-end of that range, while Barcelona and the Stockholm region were near the lower end. In China, a survey of returning workers in Wuhan suggested that only 10% of the city’s population presented antibodies. While those percentages have likely increased since the study was conducted in May, it is unlikely that the infection rate of any population has reached the 60%-to-80% level that epidemiologists say is necessary in order to achieve broad population immunity.2
Despite the ongoing spread of the novel coronavirus, we think there is little chance of a repeat economic shutdown on either a global or nation-wide scale. Instead, there will likely be a far more targeted approach that is based on testing, contact tracing, isolating and treating outbreaks—a tactic that was employed successfully by South Korea, Taiwan and Vietnam. Government-mandated social distancing and requirements to wear face masks are also expected to play prominent roles in any response to a second wave.
Most countries (particularly those with advanced economies) should be better prepared for any spikes in cases and hospitalizations, with more inventory of personal protection equipment for frontline workers, ventilators and other medical equipment and contingency plans to increase capacity of hospital beds and intensive-care units, if necessary. Better coordination among public officials and hospital systems should also help to reduce the chaos that surrounded the initial wave of the disease.
Even if blanket shelter-in-place orders are not reissued, the global economic recovery could be choppy. Until there is an effective and readily available vaccine, public health officials are likely to recommend against large gatherings in stadiums and other venues. Many who live in areas that were hard hit are likely to remain apprehensive about traveling on a commercial airplane, embarking on a cruise, or even venturing out to shop at brick-and-mortar stores. International travel may continue to be significantly constrained by government fiat, especially in the event of additional outbreaks in major cities that serve as international ports of entry. The pros and cons of restaurant dining will undoubtedly be debated, especially as colder weather takes most outdoor-dining options off the table.
Exhibit 8 highlights the reality that in the U.S., COVID-19 was proven far deadlier in a matter of three months than an entire year of influenza and pneumonia combined, and already exceeded the annual death rates of diabetes, Alzheimer’s and cerebrovascular diseases such as strokes and aneurysms. COVID-19 is now the fifth-leading cause of death in the U.S., with 385 deaths per one million people as of June 30, 2020.

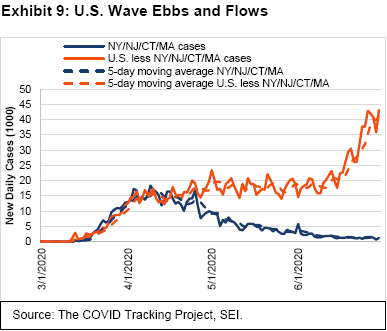
The U.S. has clearly failed to enjoy the steep decline in new infections that has been achieved in other economically-important countries, including Canada, Australia, China, Taiwan, Japan, the U.K., France, Germany, Italy and Spain. In fact, the U.S. is now heading in the opposite direction. As Exhibit 9 shows, the number of new cases among the hardest-hit areas of the U.S. has dramatically declined (including in New York, New Jersey, Connecticut and Massachusetts, all of which recorded more than 1,000 deaths per million people through the end of June). Outside of those four states, the number of active cases continues to rise.
In the final days of June, most U.S. states were recording infection rates that implied a likely increase in case numbers over time. Still, the impact of COVID-19 in some of the most recent hardest-hit states (Arizona, California, Florida, Georgia, Nevada, North Carolina, Oklahoma and Texas) has been far milder than what it was in Northeastern states and parts of Europe in the early weeks of the pandemic. In response to the upsurge in cases due to the lack of social distancing, some states have reclosed bars and restaurants and imposed mandatory wearing of face masks when in public.
Not all boats will remain afloat
The huge rebound in equity prices was particularly stunning given the bleak economic backdrop. It indicates that investors might be ignoring the possibility that it could be a long time before most companies achieve previous levels of profitability, even as an economic recovery gets under way. Exhibit 10 highlights that after-tax profit margins of U.S. domestic businesses were already on a declining trend before the onset of the virus and shelter-in-place orders.
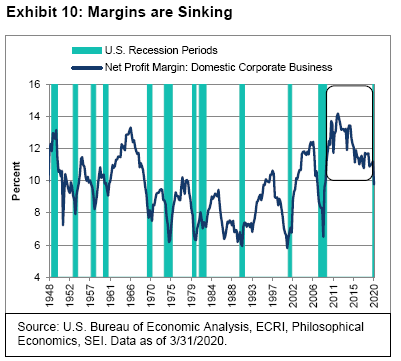
We expect final second-quarter U.S. earnings data will show that profit margins collapsed during the three-month period—yet also anticipate a rebound to closely follow as economic activity makes a comeback. Nevertheless, margins are likely to remain well below their previous peaks as long as the coronavirus is a severe health threat. Obviously, those industries that depend on crowds of people willing to sit in close proximity should continue to have difficulty with achieving top-line revenue growth and profitability that comes to even half of pre-pandemic levels. However, most companies will endure some degree of lower sales, higher costs and declining productivity.
The need to protect workers and alter the physical workplace to accommodate social distancing is just one challenge. There also will likely be a deadweight loss for those industries that now require extra inventory in order to guard against future shortages and supply-chain disruptions caused by periodic virus flare-ups. “Just-in-time” inventory management will turn into “just-in-case” inventory management, tying up cash. Supply chains will likely be further diversified over time, a process already underway as a result of the U.S.-China trade war. Although we would not say that globalization is being decisively and irreparably reversed, we do think it seems to be in decline as a result of the disruptions caused by the global pandemic and the Trump Administration’s trade fights with friends and foes alike.
Exhibit 11 is a chart that we have shown in the past. It highlights the big drivers behind the huge margin expansion recorded by manufacturing companies in the S&P 500 Index between 2000 and 2019. According to Empirical Partners, manufacturers in the S&P 500 Index enjoyed a large expansion in net profit margins over the 19-year period, from 6% in 2000 to a reading above 16% by 2019. The chart shows that 30% of that margin improvement was derived through the secular decline in interest rates. Meanwhile, falling effective corporate tax rates in the developed world and the use of tax havens provided a combined 36% of the total expansion in net margins. The remaining 34% of cumulative profit-margin expansion over the 19-year period was due to wage savings from offshoring and increased productivity of U.S.-based plants.
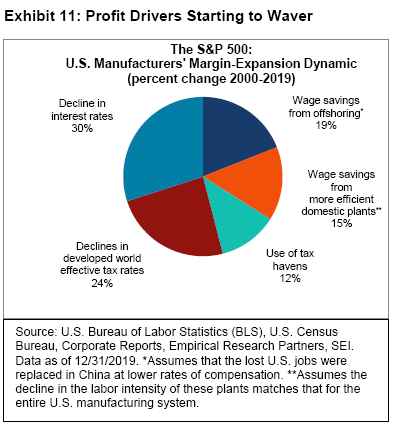
One could argue that most of these drivers have faded. Global interest rates have reached extraordinarily low levels and are unlikely to decline much further. On the other hand, they are unlikely to rise sharply anytime soon, given central banks’ efforts to suppress yields.
At SEI, we believe interest rates will be a neutral-to-negative driver in the years immediately ahead. However, in our view, tax rates can be expected to move significantly higher in the years ahead as governments across the world seek ways to recoup the money spent during the health crisis. Fiscal authorities were clamping down on the use of tax havens and seeking ways to extract more tax revenues from companies that managed to limit their taxable income through cost-shifting and transfer-pricing strategies even before the pandemic (especially those entities in the information technology sector). Finally, wage savings from offshoring is expected to become a less important source of margin expansion, especially as government policies across the world shift toward heightened trade protectionism and protecting workers from the virus. The only major available source of profit-margin expansion that remains is productivity improvement via capital investment (plants, equipment and robotics).
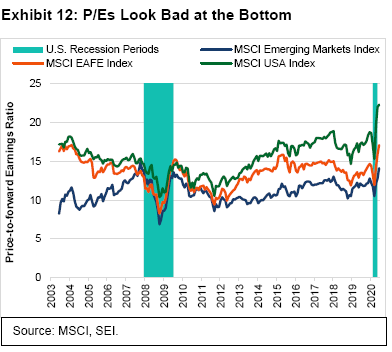
As Exhibit 12 suggests, investors have been pricing in a more optimistic future, especially for U.S. companies. It’s not unusual for the ratio of price-to-forward earnings to soar during a recession. While equity analysts in general continuously cut their earnings estimates as a recession deepens, investors tend to start ignoring those downward earnings revisions and eventually begin to bid stock prices higher in anticipation of the economic recovery that may still be several months away. This is what happened during the 2008-to-2009 global financial crisis: forward price-to-earnings ratios bottomed in October 2008; equity markets hit their lows in March 2009; and the U.S. recession ended in June 2009.
Investors largely viewed the precipitous decline in global economic activity that began in March as a global hurricane that would naturally blow out relatively quickly.
Almost no one had the slightest clue how bad things would get in the near-term. Nevertheless, governments of many countries were clearly prepared to undertake extraordinary monetary and fiscal actions to arrest the downward economic and financial spiral that would otherwise occur.
As we said in last quarter’s Outlook, “Only time will tell whether markets have sufficiently discounted the pain that lies immediately ahead. We have to be cognizant of the fact that earnings estimates are expected to come down hard—maybe by 40% to 50% on a year-over-year basis—over the next two quarters. These waterfall declines in earnings could drag equities down with them, but likely not to the same extent. It all depends on how willing investors are to look beyond the valley. If there is a belief that the fiscal and monetary measures taken in the past two weeks will successfully prop up the global economy, then markets should prove resilient. We think a great deal of volatility is still ahead of us, but another big decline along the lines of the past month could be avoided. Indeed, if there are signs that the infection rate is beginning to peak in Europe and the U.S., it may not matter where earnings go in the near term. Investors will likely begin to bid stock prices higher in anticipation of an economic recovery, as they almost always do.”
What we did not expect, however, was the magnitude of the rebound. The price-to-forward-earnings ratio on the MSCI USA Index has surged to 22 times the estimated earnings of the next 12 months. Granted, this includes some exceedingly depressed earnings readings over the next few quarters. But even if one is willing to normalize earnings per share by looking at analyst estimates 18 months into the future instead of 12 months, the stock earnings multiple would still be in the neighbourhood of 19-to-20 times. Exhibit 8 shows that equity-market valuations outside the U.S. are not nearly as stretched, although they have jumped to levels seen on only a few occasions during the past seventeen years.
Looking out for a Democratic surge
The upcoming U.S. presidential election is another concern with which investors must grapple. In the final days of June, the RealClearPolitics average of polls pointed to a drop in President Trump’s approval rating toward the lower end of the range that has been in place for much of his presidency. In addition, polls on this year’s Senate races indicate a general tightening of the most competitive races, raising the possibility of a 50/50 split following the election. Therefore, since the vice president holds the tie-breaking vote in the Senate, the odds of one-party control of the Congress (that is, by the Democrats) will have increased if the Democratic ticket indeed wins the White House. This could have major economic implications since budget-related bills can be enacted with a simple majority vote.
A study of Joe Biden’s stated tax agenda by the American Enterprise Institute (AEI)3, a conservative-leaning Washington think-tank, indicates that parts of the 2017 Tax Cuts and Jobs Act (TCJA) would be reversed or substantially modified. The following include aspects of his proposal that would affect large corporations:
- Increase the current corporate income tax rate by seven percentage points to 28%
- Increase the tax rate on foreign profits earned by U.S. multinational corporations by reducing the deduction for global intangible low-taxed income
- Eliminate tax deductions for direct-to-consumer drug advertising and fossil fuel companies, and limit some deductions for the real estate industry
- Restore the energy investment credit
On the individual tax-payer level, Biden’s tax proposal would primarily affect the top 1% of income earners. The following include elements of his tax proposal that would have the most significant impact:
- Increase the top individual income tax rate by 2.6% to 39.6%.
- Tax capital gains and dividends as ordinary income for taxpayers who report $1 million or more
- Limit the tax benefit of itemized deductions to 28%.
If all of these proposals were enacted, the AEI estimates that households and individuals in the top 1% income bracket would see a 17.8% reduction in after-tax earnings.
Of course, it is too soon to make any major investment decisions based on the outcome of the November elections. Biden’s lead in the polls as of the end of June, especially in so-called swing states, is not all that different than the lead that Hillary Clinton enjoyed at the same point in the 2016 presidential election cycle. Also worth noting: If a single political party were to secure the presidency in addition to both chambers of Congress, such a big tax package would still require significant compromise. Election promises may indicate the direction of travel, but have rarely (if ever) provided an accurate map of the voyage.
Finally, it is important to use caution when speculating about the possible economic and market impacts of a power shift in Washington. For example, while President Barack Obama’s administration was hardly viewed as a champion of corporate America or high-end wage earners, he presided over a historic bull market during most of his term (even if the recovery in real incomes and output from the global financial crisis that he inherited was tepid through much of his eight years).
At SEI, we expect taxes to rise no matter who is president or which party controls the Congress next year. Exhibit 13 tracks the U.S. federal budget deficit (and the rare occasional surplus) over the last 60 years versus the unemployment rate over the same period—against the backdrop of the country’s historical recessions. It highlights the relationship between recessions, unemployment and stimulus effort.
There are automatic economic stabilizers in place when recession hits: Tax receipts naturally decline as household incomes and corporate revenues fall; meanwhile, the government increases spending on unemployment and other social insurance programs designed to help support incomes. In more serious downturns, additional stimulus measures are often signed into law—although delays in passing the legislation have sometimes had the unfortunate result of stimulus kicking in only after the economy has already begun to recover.
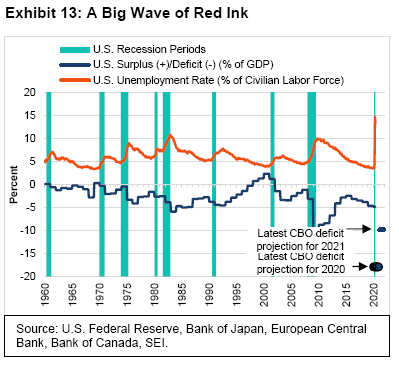
The extraordinary lockdowns across the world during March and April necessitated fiscal measures that were unparalleled in terms of both scope and implementation speed. The economic result has been a tsunami of red-inked data. In the U.S., the Congressional Budget Office (CBO) projects the deficit will reach nearly 18% of gross domestic product (GDP) during 2020 and improve to only 10% of GDP during 2021. Those forecasts exceed the CBO’s March baseline projections by 13 percentage points for 2020 and by about five percentage points for 2021. Debt relative to GDP is expected to rise to 108% by the end of the 2021 fiscal year (20 percentage points above the March estimate); by comparison, debt relative to GDP was 79% at the end of fiscal year 2019.
These are unsettling numbers. Many investors wonder whether such a surge in government debt would provoke another economic crisis after the pandemic runs its course. We don’t think that it will. The U.S. has a large, dynamic economy and deep capital markets. The buoyancy of the U.S. dollar versus other markets remains impressive (although we do expect it to decline over time since it is overvalued on a purchasing-power parity basis). If investors were truly concerned about the long-run fiscal viability of the U.S., the value of its currency would be already falling more convincingly and long-term interest rates would be going up rather than down.
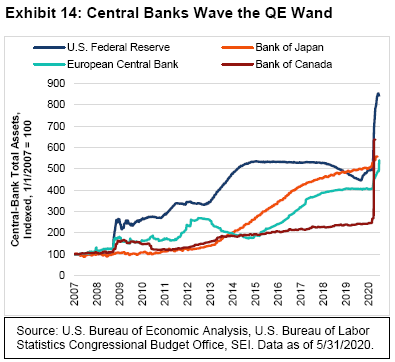
Recent policies pursued by the Federal Reserve (Fed) also serve to keep interest rates low. The central bank appears committed to keeping its policy rate at 0.1% through 2022. It has also reduced upward pressure on the entire government bond yield curve by purchasing Treasury and mortgage-backed securities. As Exhibit 14 shows, the Fed’s balance sheet has ballooned this year, far exceeding the increases logged by the European Central Bank or the Bank of Japan. The number of Treasury securities the Fed holds outright has already increased in the year to date by $1.8 trillion—and is set to rise by an additional $480 billion through the end of the 2020 (assuming the Fed sticks to the timetable announced on June 10). This projected total would cover nearly 90% of the net new Treasury issuance expected this year.
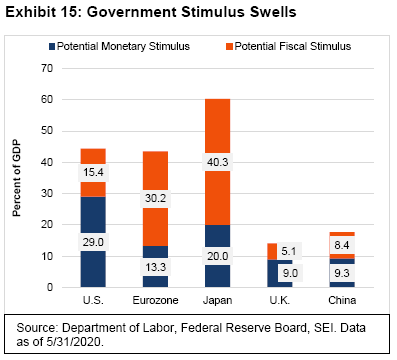
The U.S. certainly is not alone in having a huge fiscal response that is then monetized by its central bank. As Exhibit 15 indicates, most major economies are employing similar strategies. According to market research company Cornerstone Macro, the potential fiscal response to the crisis could prove even greater in Japan and the eurozone as a percentage of their economies. The key takeaway: Governments appear to be treating the fight against COVID-19 like they would a war—throwing as much in terms of resources into the fight as possible, with the efforts supported by debt issuance that is absorbed primarily by the central banks.
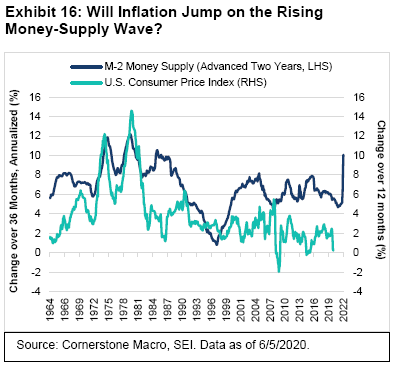
Those who remember the 1970s may be understandably worried by the inflationary potential of such extraordinary debt monetization. As we highlight in Exhibit 12, money-supply (M24) growth in the U.S. has taken flight. But will it lead to inflation? If so, we don’t think that will occur any time soon. Much of the jump reflects a surge in precautionary balances held by businesses and households; shelter-in-place orders have also played a role, especially for households. With many businesses closed or operating at a much-reduced rate of capacity, the ability to spend has been hampered.
We suspect a good deal of the spike in M2 growth will unwind as economic activity ramps back up; but that does not necessarily mean that there will be a sustained rise in the general price level. After all, changes in the money supply have historically had a long and variable lag time before they affect output and inflation, even when the relationship appeared to be stronger prior to the 1980s. In Exhibit 16, we juxtaposed the three-year change in M2, pushed that line out two years, and compared it against the consumer-price index (which measures the inflation rate). This highly simplified approach suggests that there might have been predictive value in tracking money growth back in the 1960s and 1970s, but things began to go awry beginning in the early 1980s (ironically, just a few years after the central bank adopted money growth as an explicit policy target). Given our view that the economy will remain below full utilization of labour and productive capacity for the next few years, we believe inflation is unlikely to break out of the 0%-to-3% range it has been in for almost a decade.
Europe looks wavy, too, as it bids the U.K. adieu
Much of the above analysis regarding the U.S. can be applied to Europe, the U.K. and Japan. Exhibit 17 tracks the number of weekly confirmed cases of COVID-19 in major European countries and the U.S.
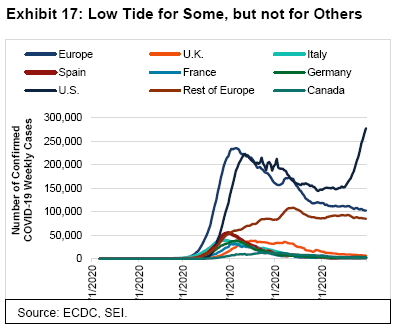
One can see that Italy, Spain, France and Germany have been successful in reducing their respective infection rates (although Germany began reporting an uptick in late June). In Italy, the number of reported cases plummeted from a peak of 39,504 during the week ended March 27 to just 1,716 cases for the seven days ended June 30. The U.K. also recorded a significant decrease from its peak, but its weekly totals remain somewhat elevated compared to the other four European countries represented in the chart.
The countries comprising the rest of Europe—including Russia, Ukraine, Sweden, Poland, Portugal and Romania—unfortunately continue to run much closer to their collective peak rate. Like the various U.S. states, different countries have taken varying approaches in combatting the virus; the more devastating the experience in a certain region, the better the compliance with social distancing rules and other measures such as wearing face masks.
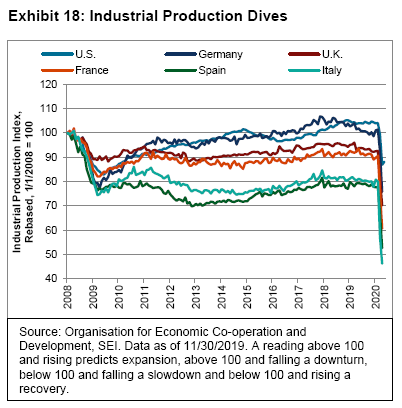
Exhibit 18 shows that the lockdowns delivered a hard hit to European industrial output. Production plunged 42% in Italy and 32% in Spain. Although Germany did not see the same percentage of infections and deaths as other countries, the nation’s economy was not spared; industrial output fell 25% (about on par with the U.K.). The global production contractions over a period of two months were worse than a single peak-to-trough decline recorded over a one-year period during the global financial crisis. Activity is now picking up as lockdowns and shelter-in-place orders have eased and economic stimulus feeds into renewed household and business spending.
The increase in activity can be seen particularly dramatically in IHS Markit’s “flash” composite purchasing managers’ index (PMI) data, which is based on provisional survey responses (85% of the monthly total) from services and manufacturing companies. As illustrated in Exhibit 19, nearly half of survey respondents in the euro area reported improving or “less bad” business conditions in June. France seems to be leading the way, with manufacturers and services-providers alike finishing the second quarter above 50.0 (the demarcation line separating positive versus negative performance).
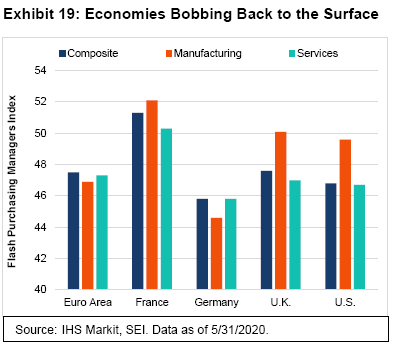
Exhibit 20 highlights that leading economic indicators in euro-area countries are also beginning to recover, even if still profoundly depressed.
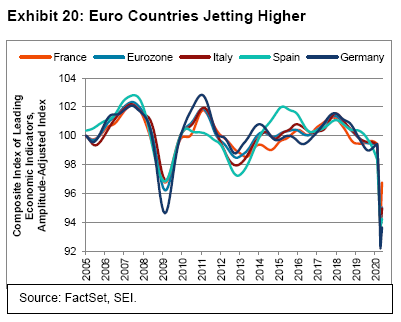
Each country has its own set of leading indicators, but there are some commonalities. Financial indicators (for example, money supply, share prices, credit spreads) began rising first, as they usually do. Confidence measures also are recovering, as are signs of household buying (especially autos, presumably to avoid public transit). Still, there is a long way to go before normal operating levels are achieved across the eurozone.
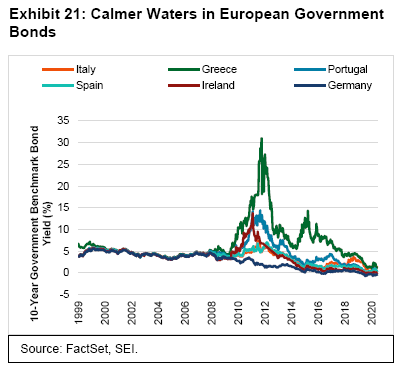
Investors, however, do not seem too concerned about the speed of the recovery or the impact of the health crisis on countries’ fiscal positions. Exhibit 21 underscores the fact that government bond yields of the most economically fragile countries remain close to those of the far more stable German bunds. Although spreads over bunds have widened from pre-pandemic levels, they certainly have not widened as significantly as they did during the multi-year debt crisis that began in 2010 in peripheral European countries.
As of June 30, Italian bond yields were trading at 1.24%, lower versus the start of the year. Greek bonds, meanwhile, finished the second quarter at 1.20%, some 23 basis points below their year-end 2019 reading; it’s hard for us to believe that Greek 10-year benchmark bonds traded as high as 34.33% in February 2012 at the peak of the periphery debt crisis. The European Central Bank has been quite successful in short-circuiting the liquidity crisis and flight-to-safety that threatened the euro area’s financial structure.
Investors’ relaxed outlook would be severely challenged if the 27 members of the EU fail to approve the €750 billion emergency fund when member-state leaders meet in July. Although Germany has joined forces with France to push the package forward, there is still resistance from the likes of the Netherlands, Sweden, Denmark and Austria. There is disagreement, for example, over the split between grants and loans. The European Commission proposes €500 billion in grants, based on recovery needs, with Italy and Spain the biggest beneficiaries. The remainder of the package would be distributed as loans that would be subject to certain conditions while also adding to countries’ debt loads. Determining how to pay for the grants is an even greater source of contention. Under the plan, the European Commission would be empowered to issue long-term bonds. These bonds would be paid down by giving the Commission authority to raise revenue through taxation, a power it currently does not have. The only alternatives would be to increase contributions from member states (which would be a bigger burden now that the U.K. is leaving the EU) or enact spending cuts in other parts of the EU budget.
Speaking of the U.K., the COVID-19 crisis has pushed Brexit concerns off the front pages. As the December 31 departure deadline nears, the divorce could become an economic factor nearly as important as a second wave of the virus. There has been little movement in recent months as U.K. and EU negotiators haggle over fishing rights and, even more important, the U.K.’s future access to the single market. The June 30 deadline to seek an extension of the transition period beyond the end of this year has now passed. If a deal on the U.K.-EU trading relationship is to be delivered before the year’s end, it probably should be concluded by the close of October so that countries have time to approve the treaty into law. Any free-trade agreement with the EU would be based on the U.K. acceding to a “level playing field”—that is, agreeing to a permanent alignment of its rules and regulations with those of the EU on such matters as the environment, labour standards, state aid to industry, and corporate taxes. This would be tough for the U.K. government to swallow, as it means the country would essentially bear much of the cost of EU membership without having a voice at the table that sets the rules.
While many negotiations often involve dramatic last-minute agreements, the lackadaisical pace of Brexit talks is troublesome. It is increasingly likely that there either will be a modest agreement that includes tariffs, or (in the worst-case scenario) a no-deal result that falls back on the World Trade Organization’s most-favoured-nation rules.
Exhibit 22 on the following page shows that sterling fell sharply against both the euro and the U.S. dollar in the run-up to the June 2016 Brexit vote, and plunged further in the months that followed.
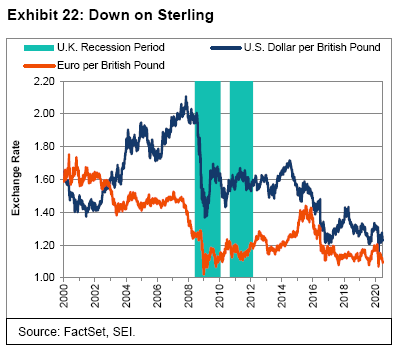
The British pound remains near its lowest levels of the past 20 years, so a case can be made that a no-deal Brexit is already mostly reflected in the currency’s value. Yet the economic damage caused by the COVID-19 crisis, the deterioration in U.K. government finances, the re-ramping up of gilt purchases by the Bank of England, and the looming threat of a no-deal Brexit should all serve to cap sterling’s appreciation potential this year.
Emerging markets: Some are riding the wave, while others are swamped
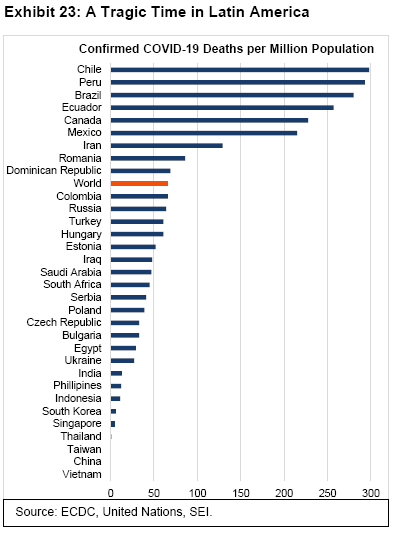
Warren Buffet famously said that you don’t know who’s swimming naked until the tide goes out. The COVID-19 crisis illustrates his point: Developing economies and regions have chosen wildly varying responses and have experienced sharply different health outcomes. Exhibit 19 uses population data to show the number of deaths per million people in a selection of emerging-market countries. We chose to examine death counts instead of case counts because of the lack of testing in some of these countries. Unfortunately, even the number of deaths may be underreported in places like Mexico and Brazil because many victims die at home and may not be officially listed as COVID-19 deaths. Even those who die in a hospital are not necessarily listed as confirmed COVID-19 fatalities in some of these countries; and only some report suspected COVID-19 as confirmed deaths from the virus.
Exhibit 23 clearly shows that Latin America has suffered the highest number of COVID-19-related losses. Peru, Brazil, Ecuador, Chile and Mexico each registered between 200 and 300 deaths per million population as of June 30. On the other side of the spectrum are countries in Southeast Asia. China has logged only 0.2 deaths per million despite the early devastation in Wuhan. Vietnam and Cambodia have reported no deaths. Taiwan and Thailand have reported less than one death per million population. Daily new confirmed COVID-19 deaths continue to rise rapidly in places like Brazil (6.02 per million) and Chile (5.91 per million); although the epicentre appears to be shifting toward the Middle East, where Iraq, Iran, Bahrain, Oman, Kuwait and Egypt are recording increases that exceed the worldwide pace.
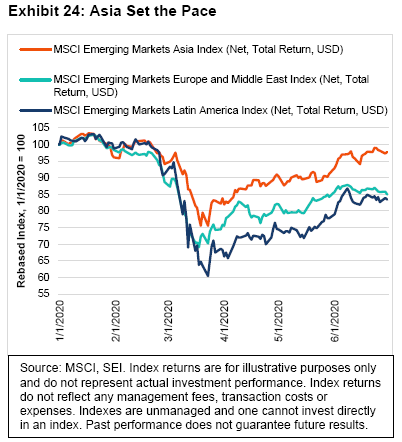
While many other factors determine equity performance, Exhibit 24 suggests that, in the emerging-market space, it has correlated with the extent of the economic disruption caused by the virus. The MSCI Emerging Markets Asia Index (total returns) didn’t fall as much as its MSCI Emerging Markets Latin America and MSCI Emerging Markets Europe & Middle East counterparts. The MSCI Emerging Markets Asia Index (net, total return) was down a mere 2.3% in the year to date, while the MSCI Emerging Markets Latin America Index (net, total returns) was still off 16.6% for the year to date.
In terms of economic activity, most emerging countries appeared to bottom-out in April; but the recovery has been uneven. Emerging Asia and Europe have enjoyed stronger recoveries than Latin America or India. According to data supplied by Capital Economics, year-over-year declines (as of May 31, 2020) in retail sales and industrial production fell the sharpest in Peru, Argentina and Colombia (with percentage declines between 30% and 60%). European countries including Romania, Hungary, the Czech Republic and Turkey registered drops of between 20% and 30%. Asian countries such as Malaysia, Vietnam, China, Korea and Taiwan logged minimal year-over-year pullbacks; in fact, retail sales in Malaysia inched higher in April, while industrial production in Taiwan rose versus year-ago levels.
It should be no surprise that a country’s economic performance correlated negatively with the stringency of its lockdowns. Asian and Central European countries have recorded the sharpest reduction in constraints on movement and social interaction. Latin America and India have seen some easing of those constraints, but not nearly as much as the other two regions.
We continue to keep close tabs on China since it was the first country to mandate a lockdown and the first to unlock its mandate. Although flare-ups in the infection rate continue in some parts of the country, they appear to be relatively isolated and well-contained. Car travel in major cities seems to be almost back to normal, although subway usage is still short of pre-pandemic levels. Long-distance travel, especially by air, remains about half the previous norm. Manufacturing and construction are much closer to pre-pandemic levels than household spending on restaurants and other services that involve close contact or crowds. We expect to see similar recovery patterns elsewhere in the world.
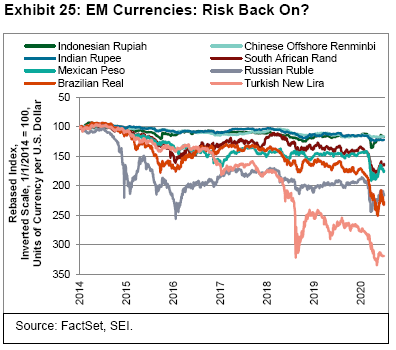
Central banks in the emerging world are doing their part to help restore their economies. Interest rates have come down in almost every country in recent months to record-low levels in many cases. Several countries have policy rates of 0.5% or lower, including South Korea, Thailand, Poland, the Czech Republic, Peru and Chile. Seventeen countries have slashed their rates by 100 basis points or more. In addition, a dozen emerging-market central banks are buying or planning to buy their government’s debt. These central banks include those with shakier reputations, such as South Africa and Turkey. This debt-monetization may lead to an inflation problem in the future. As Exhibit 25 shows, emerging-market currencies have been under pressure this year, although they have strengthened considerably from their recent lows.
SEI: A steady navigator in troubled waters
Last quarter, we noted that, “...with a pandemic crippling the global economy and an oil glut exacerbated by suspended economic activity around the globe, we find ourselves in an environment almost completely void of reliable information—which, to us, makes frantic trading an especially unwise approach to financial stewardship.” Those words are, perhaps, even truer today.
While the level of chaos and volatility in financial markets has abated in the face of unprecedented government stimulus, it has become apparent that COVID-19 will remain a challenge to the global economy for the foreseeable future. With many companies suspending earnings guidance, traditional methods of valuing companies are no longer valid.
What actions are investment managers taking?
SEI hires investment managers and allocates assets to them with the expectation that those managers will remain true to their processes regardless of market conditions. Value-oriented mangers are expected to buy value stocks. Government-bond managers are expected to buy government bonds. Radical changes to investment process are not something that we expect to see. Of course, volatile markets are the true test of a manager’s resolve, and we are pleased to say that our mangers have stayed true to their strategies.
In Canadian equity markets, information technology (IT) and gold are at 52 week highs, with other sectors still down year to date. The investment managers in our portfolios have trimmed IT, taking profits and adding selectively to industrials (railroads) in anticipation of a sustained recovery in economic activity. Consumer staples remain an overweight sector, while energy and materials remain at less-than-benchmark settings. At the overall market level, projections for equity earnings per share for 2021 are still in line with the results seen in 2019 (the last pre-pandemic annual result).
In the U.S., growth stocks continued their run of strong performance as value and low-volatility stocks trailed. The weight of the largest five companies in S&P 500 Index is near record levels. Our actively managed U.S. large-cap strategies are structurally underweight these names, because our value managers and stability managers tend not to own them. It’s not just that these stocks appear expensive; it’s also because some important sectors (financials and energy) have become cheap. While our results have lagged the S&P 500 Index, we plan to stay the course with our value tilt and underweight to mega-cap stocks that have become expensive and so concentrated in indexes. We believe the payoff will come to those who are patient and persistent, sticking with a strategy even when market conditions make it difficult to do so. We don’t expect the managers we work with to change their investment philosophy and process based on temporary market conditions (even during extended periods of underperformance), and we don’t plan to change ours either.
In U.S. small caps, the second quarter saw the beginnings of a recovery as small-cap stocks outperformed large caps, as measured by the Russell 2000 and 1000 Indexes, respectively. (They still trailed by about 10% for the year to date.) The poor performance of stability and low-volatility oriented stocks during the quarter continued to hamper managers. Overall positioning remained unchanged.
Our international equity portfolios also favour value, which briefly helped in May, but growth and momentum remain the primary drivers of equity market returns. Positioning changes have been minor—value managers added slightly to energy holdings while momentum and stability managers focused mostly on healthcare and information technology.
Emerging markets were up for the quarter as trade-war issues with China seem to have levelled off, yet there was little capital inflow as investors remained cautious. As in other sectors of the equity markets, value stocks saw weak results and low-volatility struggled.
With regard to portfolio positioning, SEI’s Canadian fixed-income strategies do not see much value in Federal and provincial bonds. They prefer to overweight corporate credit and cash. They also are slightly underweight duration relative to benchmarks. There is concern that more ratings downgrades are on the way, especially for the provinces. They were not in the best of fiscal shape before the pandemic struck. Our managers are moving up the quality scale too. A heavy sector overweight to banks has been reduced significantly owing to concerns over the loan-repayment deferrals given to their customers. Unfortunately, the heavy involvement of the Bank of Canada in the private-debt markets has made it very hard to judge the ability of borrowers to repay their debts. This is not unique to Canada, of course. But the inability to determine borrowers’ ability to pay will likely cause future problems once the pandemic fades and the government seeks to reduce emergency-support programs.
U.S. investment-grade fixed income markets saw a strong second quarter that began with solid performance in April and May that continued into June. The narrowing yield spread between government and corporate bonds signified that investors’ confidence in the solvency of corporate bonds issues has improved dramatically. Reinforcing this perspective, companies were able to issue new bonds at a record pace in April and came close in May. June issuance has been strong. Bond markets have seen a year’s worth of supply generated in just five months.
The Fed began buying corporate bonds, with less of an emphasis on exchange-traded funds and more emphasis on individual corporate bonds. These may not be substantial purchases right now, but enough to give market confidence that the Fed will act to maintain functioning markets. Additionally, the Fed has put the prospect of negative interest rates on the back burner, stating that they would not really consider it as a policy tool in the near term.
In this environment, Canada fixed-income markets were strong in the second quarter. Our positioning has not changed much. There has been some sector rotation and security selection. We have been reducing the overweight to financials and are rotating to higher-quality issues and selling non-viable contingent capital (debt that can be converted to equity if regulators feel the need).
Our posture is slightly defensive, as we cannot assess true risks in the bond market given so much government intervention. The big picture remains the same; we are overweight corporates and cash with a slight underweight to duration. Overall, the support system is good for keeping the economy afloat and reducing downside risk, but is also distorting the ability to assess true fundamental risk.
U.S. core investment-grade strategies trimmed risk modestly even as managers added high-quality names with strong balance sheets to their portfolios. Corporate spreads were at 1.50 percentage points at the end of the quarter, the same as 2015/16. This is still relatively attractive, especially with the Fed supporting the market. Our expectations are for a continued range-bound yield environment. Right now, we're at the lower end of the range. So our positioning is relatively neutral in terms of duration.
Our high-yield portfolios have seen little change in terms of sector positioning. Managers remain cautious given the material snapback in performance and uncertainty with COVID-19 cases ticking back up. The new issue market continues to be a primary focus for managers. We have seen seven consecutive weeks in excess of $10 billion in new issuance and a record $55 billion in June. This carried over into the structured credit market, with strong new issuance and relief that companies have done a good job in raising liquidity. The energy sector, however, continued to be volatile.
In emerging-markets debt, spreads have compressed considerably in the investment-grade space, making high-yield more attractive. Our portfolios have moved close to neutral on a duration basis.
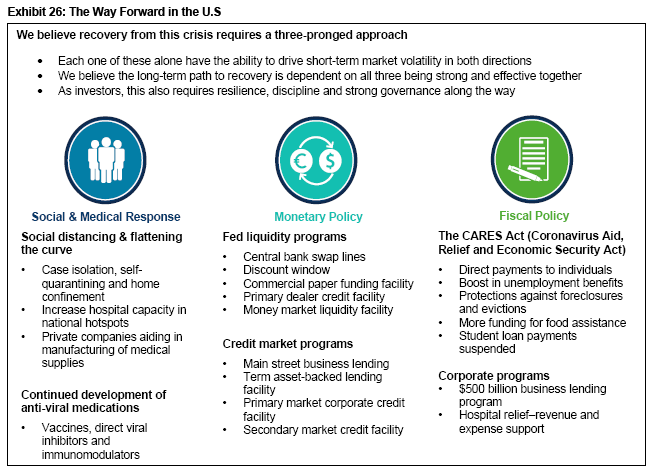
Emergency response efforts
Exhibit 26 summarizes the approach that is being used to fight the pandemic in the U.S. That approach involves fiscal, monetary and social/medical responses. As the impact of the disease grinds on, we are finding that all three prongs are of critical importance.
What’s Next?
In the short term, it is difficult to predict what lies ahead. Although that sentiment seems more relevant today than ever before, it is always the case. Humans are hardwired to believe that the recent past will repeat itself indefinitely, but history has shown us time and time again that it isn’t true.
In the longer term, we believe the pandemic will end, the global economy will return to full functioning, government stimulus will be removed (eliminating asset price distortion) and traditional metrics of stock market valuation will once again be valid. When that occurs, investors will view today’s world-shaking events as a W-shaped or L-shaped line on a chart tracking stock market performance. In the meantime, we and the investment managers that we work with will continue to build diversified portfolios in an effort to help investors achieve their financial goals regardless of current market conditions.
Glossary
Cyclical sectors, industries or stocks are those whose performance is closely tied to the economic environment and business cycle. Cyclical sectors tend to benefit when the economy is expanding.
Duration is a measure of a security’s price sensitivity to changes in interest rates. Specifically, duration measures the potential change in value of a bond that would result from a 1% change in interest rates.
Earnings multiple is equal to the stock price divided by earnings per share. It is expressed in years. For example, an earnings multiple of 10 means that it would take 10 years of earnings to equal the stock price.
P/E ratio is equal to a company’s market capitalization divided by its after-tax earnings. The higher the P/E ratio, the more the market is willing to pay for each dollar of annual earnings. A forward P/E ratio is a current stock’s price divided by its estimated earnings per share over the next 12 months.
Value refers to the tendency of relatively cheap assets to outperform relatively expensive assets.
Index Definitions
Composite Index of Leading Indicators: used to measure turning points in the business cycle. The metric looks at qualitative data on short-term economic movements. It is used to predict the direction of global economic movements in future months.
Industrial Production Index: an indicator used to measure monthly output in the manufacturing, mining, electric and gas industries.
MSCI EAFE Index: an unmanaged, market-capitalization-weighted equity index that represents the developed world outside North America.
MSCI Emerging Markets Asia Index: designed to measure the performance of the large- and mid-cap segments across nine emerging-market countries in Asia.
MSCI Emerging Markets Europe and Middle East Index: captures large and mid-cap representation across 8 emerging-market countries in Europe and the Middle East.
MSCI Emerging Markets Index: a free float-adjusted market-capitalization-weighted index designed to measure the performance of global emerging-market equities.
MSCI Emerging Markets Latin America Index: designed to measure the performance of the large- and mid-cap segments across six emerging-market countries in Latin America.
MSCI USA Index: designed to measure the performance of the large- and mid-cap segments of the U.S. market. The Index covers approximately 85% of the free float-adjusted market capitalization in the U.S.
MSCI World ex USA Index: a free float-adjusted market capitalization weighted index that is designed to measure the equity market performance of developed markets, not including the U.S.
Purchasing Managers Index: an indicator of economic health for manufacturing and service sectors. Its purpose is to provide information about current business conditions to company decision makers, analysts and purchasing managers.
Russell 1000 Index: includes 1,000 of the largest U.S. equity securities based on market cap and current index membership; it is used to measure the activity of the U.S. large-cap equity market.
Russell 2000 Index: includes 2,000 small-cap U.S. equity names and is used to measure the activity of the U.S. small-cap equity market.
S&P 500 Equal Weight Index: an unmanaged index that consists of 500 of the largest publicly-traded U.S. companies and is considered representative of the broad U.S. stock market. In comparison to the market-weighted index, it gives the same weight, or importance, to each stock. The smallest companies are given equal weight to the largest companies
S&P 500 Index: an unmanaged, market-weighted index that consists of 500 of the largest publicly-traded U.S. companies and is considered representative of the broad U.S. stock market.
Important Information
SEI Investments Canada Company, a wholly owned subsidiary of SEI Investments Company, is the Manager of the SEI Funds in Canada.
The information contained herein is for general and educational information purposes only and is not intended to constitute legal, tax, accounting, securities, research or investment advice regarding the Funds or any security in particular, nor an opinion regarding the appropriateness of any investment. This commentary has been provided by SEI Investments Management Corporation (“SIMC”), a U.S. affiliate of SEI Investments Canada Company. SIMC is not registered in any capacity with any Canadian regulator, nor is the author, and the information contained herein is for general information purposes only and is not intended to constitute legal, tax, accounting, securities, or investment advice, nor an opinion regarding the appropriateness of any investment. You should not act or rely on the information contained herein without obtaining specific legal, tax, accounting and investment advice from qualified professionals. This information should not be construed as a recommendation to purchase or sell a security, derivative or futures contract. You should not act or rely on the information contained herein without obtaining specific legal, tax, accounting and investment advice from an investment professional. This material represents an assessment of the market environment at a specific point in time and is not intended to be a forecast of future events, or a guarantee of future results. There is no assurance as of the date of this material that the securities mentioned remain in or out of the SEI Funds.
This material may contain "forward-looking information" ("FLI") as such term is defined under applicable Canadian securities laws. FLI is disclosure regarding possible events, conditions or results of operations that is based on assumptions about future economic conditions and courses of action. FLI is subject to a variety of risks, uncertainties and other factors that could cause actual results to differ materially from expectations as expressed or implied in this material. FLI reflects current expectations with respect to current events and is not a guarantee of future performance. Any FLI that may be included or incorporated by reference in this material is presented solely for the purpose of conveying current anticipated expectations and may not be appropriate for any other purposes.
There are risks involved with investing, including loss of principal. Diversification may not protect against market risk. There may be other holdings which are not discussed that may have additional specific risks. In addition to the normal risks associated with investing, international investments may involve risk of capital loss from unfavourable fluctuation in currency values, from differences in generally accepted accounting principles or from economic or political instability in other nations. Emerging markets involve heightened risks related to the same factors, in addition to those associated with their relatively small size and lesser liquidity. Bonds and bond funds will decrease in value as interest rates rise.
Information contained herein that is based on external sources is believed to be reliable, but is not guaranteed by SEI Investments Canada Company, and the information may be incomplete or may change without notice.
Commissions, trailing commissions, management fees and expenses all may be associated with mutual fund investments. Please read the prospectus before investing. Mutual funds are not guaranteed, their values change frequently and past performance may not be repeated.


