Economic Outlook: Canadian Equities Transcend Trade-War Worries
Canadian equity investors with a home bias have endured a long run of underperformance relative to U.S. equities: While the MSCI Canada Index (net, total returns) climbed a cumulative 150% from the beginning of 2009 through September this year, the MSCI USA Index (net, total returns) gained almost 320% over the same period (Exhibit 1). Of course Canadian investors are not alone. Most non-U.S. stock markets have badly lagged U.S. equities in local currency-terms over the past 10 years, and even more so when factoring in the multi-year appreciation of the U.S. dollar against their respective local currencies.
If there’s any good news to be had, it’s that Canadian equities have improved in relative terms, only slightly lagging the U.S. since early 2018. As illustrated in Exhibit 1, the line depicting relative strength flattened following a sharp deterioration that began in 2011 to the end of 2017. It may seem surprising that Canadian equities have been holding their own, considering all the trade-war anxieties—with U.S. President Donald Trump’s imposition of steel and aluminum tariffs on several countries including Canada early last year (which he subsequently removed for some, including Canada); Trump’s renegotiation of the North American Free Trade Agreement, renamed the U.S. Mexico Canada Agreement (USMCA), that has yet to be formally approved by U.S. Congress; and the increasingly testy relationship of both Canada and the U.S. with China due to Canada’s house arrest (at the request of U.S. authorities) of a high-ranking Huawei official battling extradition to the U.S.
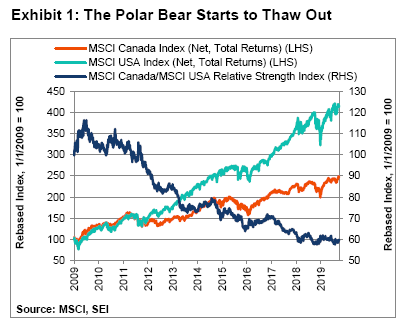
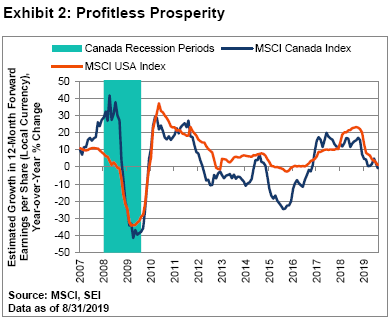
Exhibit 2 helps explain the change in trend. Over the last three years, Canada’s estimated growth in 12-month forward earnings per share has mostly kept pace with those of the U.S. By contrast, Canadian firms consistently lagged the U.S. from 2011 to 2016 in the profits-performance derby. Part of this long-term earnings underperformance simply reflected the fact that the MSCI Canada Index is heavily weighted toward financials, energy, materials and industrials; together, these sectors account for three-quarters of the index’s market capitalization. Meanwhile, information technology amounts to only 6.5% of the MSCI Canada benchmark, but represents 22.3% of the U.S. benchmark’s market capitalization. When growth in the global economy begins to reaccelerate, as it did in 2016, we expect commodity-dependent Canada to be a primary beneficiary.
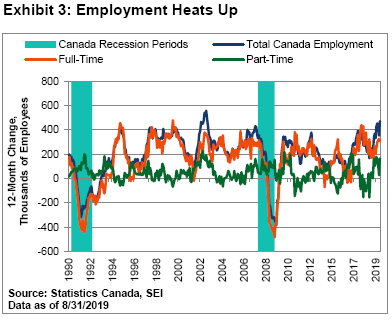
The country’s economic growth has been tepid, running between 1.5% and 2.0% on a year-over-year basis since the middle of 2018. Household consumption growth has been slowing since mid-2017, burdened by high mortgage debt and rising interest rates. In the second quarter of 2019, Canadian personal consumption expenditures posted their slowest rise (0.6% at a seasonally-adjusted annual rate) since the second quarter of 2012. We expect spending to improve, however, owing to the underlying strength of the labour market. The unemployment rate remains near its lowest level recorded in more than four decades. Moreover, as seen in Exhibit 3, the number of persons employed expanded by 471,000 over the 12-months ended August. Granted, part-time employees accounted for more than one-third of this improvement as the service-oriented “gig economy” has become increasingly important. Nonetheless, the number of better-paying and more stable full-time jobs has moved to a healthy level over the past year.
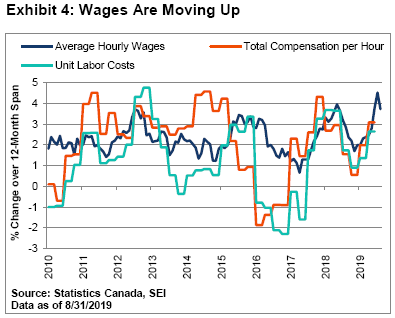
The tightening labour market has been putting upward pressure on compensation and unit labour costs, as illustrated in Exhibit 4. Average hourly wages breached the 4% mark on a year-over-year basis, the first time that has happened since the initial recovery out of recession in 2009. The other measures (total compensation per hour and unit labour costs) have not been quite as strong as hourly wage growth, but have been accelerating since the end of last year.
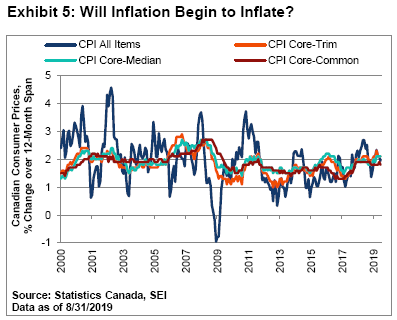
The rising trend in labour costs has not yet led to a worrisome acceleration in inflation. Exhibit 5 shows that Canada’s headline consumer-price index (CPI), which includes all items, and other measures of Canadian inflation tracked closely by the Bank of Canada (BoC) remain in a rather narrow range around the BoC’s 2% inflation target. Of course, one can see that inflation, as measured by the CPI, has accelerated in recent years. From the 2010 to 2015, the less volatile core CPIs mostly fluctuated near the 1.5% mark from year to year. Headline CPI tracked much lower owing to the persistent decline in energy prices.
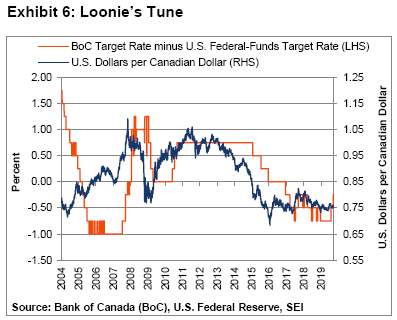
With the buoyancy of the labour market, rising wages and costs, and an inflation rate that is close to target, BoC monetary policymakers face a dilemma. Should they keep the current policy rate or should they cut the rate in order to maintain the spread against the U.S. federal-funds rate? If they decide to keep the policy rate unchanged, the interest-rate spread would narrow. That could cause the Canadian dollar to rise against the U.S. dollar, making Canadian exports less competitive. Exhibit 5 highlights the correlation between the policy-rate spread and the loonie’s fluctuations.
On October 21, Canadian voters go to the polls to determine whether Liberal Prime Minister Justin Trudeau loses his position to Andrew Sheer, the Conservative Party candidate. This outcome seems increasingly possible, owing to recent controversy tied to Trudeau—including apparent missteps related to the SNC-Lavalin affair, and the surfacing of pictures with him in blackface. But the Liberals and the Conservatives are neck-and-neck in the polls. In our view, the chances of getting a minority government (that is, when no party has a majority of seats in the legislature) appear high. There are certainly some differences between the two parties. Sheer has been running against the federal carbon tax, a stance that has enhanced his popularity in the western provinces. However, the ideological gap on economic issues does not appear to be anywhere near as wide between the two major parties as it is between the Republicans and the Democrats in the U.S. or the Conservative and Labour Parties in the U.K. While the Canadian Conservatives may be perceived as more business-friendly, we do not foresee any big policy changes coming down the pike from a change in leadership.
SEI’s Canadian equity managers’ allocations to stocks with value, stability and momentum characteristics remained neutral versus strategic weights. Unlike value stocks elsewhere around the globe, value in Canada does not look cheap. This includes the energy sector, which bulks large in the MSCI Canada Index. The momentum style had a nice run before pulling back in September; our momentum manager was overweight gold companies. Stability, meanwhile, continued to sport relatively high valuations.
Our fixed-income managers continued to overweight corporate credit, primarily financial stocks. They do not expect the BoC to implement an interest-rate cut, but they do expect the yield curve to flatten a bit between 2 and 10 years.
Animal Dispirits: From Aging Bull to Market Mule?
There are bull markets, and there are bear markets. But since the current U.S. bull market set a longevity record when it turned 10 years old this past March, equities have moved back and forth, sticking stubbornly to a narrow range. Rather than a bull or a bear, we think this market is more accurately described as a mule with a mind of its own.
Long-time readers of SEI’s Economic Outlook know that we’ve leaned toward an optimistic view of equities and other risk-oriented assets for the past 10 years. It’s been our position that equity bull markets are tough animals to kill. In the instances that markets sharply corrected during this period—sometimes exceeding the 10% minimum drop from recent highs that qualifies as a moderate correction, as several U.S. equity indexes did in 2011, 2015 and late last year—we viewed the pullbacks as buying opportunities. While it may have seemed that SEI was not ideally positioned amid the periodic downdrafts of 10% or more that occurred during this long upward march, we believe our strategy of staying invested according to our clients’ mandates has proven to be sound.
Equities around the globe went through yet another downturn in the third quarter of this year. Up to this point, the declines have been relatively mild, at least as measured by broad benchmark indexes. The damage to the S&P 500 Index (the widely followed U.S. equity benchmark) has been particularly modest, recording a peak-to-trough decline of 6% in early August during the worst of its drop. Other sectors of stock-market (small-caps, emerging markets and international developed equity) posted somewhat sharper declines during the selloff. While markets have rallied from recent lows, investors have been subjected to vicious whipsaws at the industry, sector and factor levels, making the decline feel much worse than it actually has been.
Stock prices fluctuate—it’s just the nature of the beast. This is highlighted in Exhibit 1, which illustrates that dips of 5% or more in the S&P 500 Index (price only) happen frequently, averaging between three and four times per year over the past 91 years, according to a study conducted by Ned Davis Research (NDR). Remarkably, the S&P 500 Index (price only) has experienced a drop of this magnitude only 14 times since 2010. That’s less than half the historical frequency. Following the low in February 2016, not one dip was recorded until February 2018: A near-record-breaking run. This year, there have been two dips so far. The first came in the May-to-June period, amounting to a peak-to-trough pullback of 6.8%. The second may still be underway, with the S&P 500 Index (price only) declining from its daily closing high of 3025.86 on July 26 to its most recent low of 2840.60 on August 14. This represented a decline of only 6.1%. We refer to such modest drops (those of 5% or more) as “just because” declines because they can occur for little to no reason. At the end of September, the S&P 500 Index was only 1.6% off its record high.
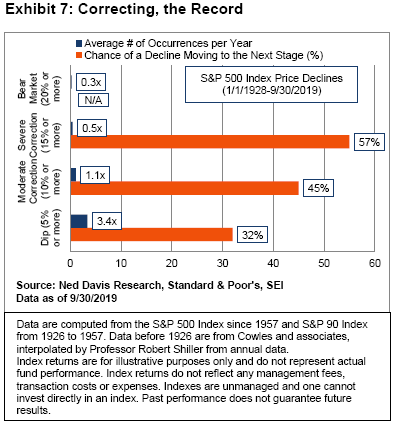
The chart in Exhibit 7 also shows the odds of moving to a more serious price decline. Historically, almost one-third of minor dips became moderate corrections, which NDR defines as a peak-to-trough decline of 10% or more. These corrections have taken place a bit more than once per year, on average, since 1928. There have been six such corrections during this decade-long bull market, so fewer than the long-term average. However, 42% of market “dips” (declines of 5% or more) became at least moderate corrections (declines of 10% or more) in the current bull-market cycle: A higher percentage than we’ve seen in the past.
The move from a moderate to a severe correction (declines of 15% or more) has occurred 45% of the time historically, with an average frequency of one occurrence every two years. There have been only three such episodes since 2010, the most recent one taking place in the fourth quarter of last year. However, this means that half of the moderate corrections during this cycle have turned into severe ones.
Although the average bear market has occurred roughly once every three years since 1928, there have been only three since 1982 (in 1987, the 2000-to-2002 period, and the 2007-to-2009 period). At SEI, we still doubt that an actual bear market is on the immediate horizon. However, even we are surprised by the resilience of the stock-market averages during the third quarter in the face of numerous economic and political uncertainties, both in the U.S. and globally.
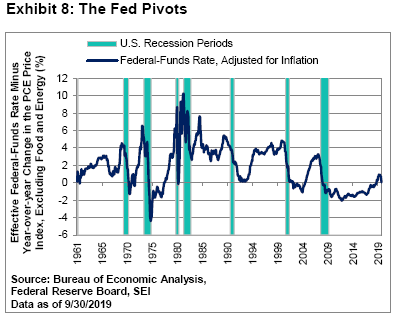
We like to say that bull markets do not die of old age—they get murdered. The U.S. Federal Reserve (Fed) is usually the killer, with sharply rising interest rates as the weapon. However, the script is different this time around. The Fed’s policymakers voted twice this year to lower the federal-funds rate, first at the end of July and again in September, by 0.25% each time. Additional rate cuts are widely expected to come before year end.
As Exhibit 8 highlights, the latest reduction brings the inflation-adjusted federal-funds rate back toward zero—a nominal target range of 1.75% to 2.00%, adjusted for a year-over-year inflation rate of 1.8% as of September 30.
Fed Chairman Powell has pointed out that the federal-funds rate typically declines by roughly five percentage points during easing cycles when an economic recession materializes. There is no room for such a big reduction this time around, hence the likelihood that the Fed will return to its unconventional monetary-policy toolbox in the event of an economic downturn. This should help minimize the hit to equity markets. We note that the Fed has already halted quantitative tightening, meaning that it is no longer letting its balance sheet contract as securities in its portfolio mature, and will now reinvest principal payments.
If the economy were to weaken in a serious way, the Fed could ramp up its purchases of U.S. Treasurys once again. We view this as especially likely since there is little room for the central bank to cut its policy rate (in nominal terms) before it hits zero and turns negative, as is now the case in Japan and much of Europe.
The argument for a moderate equity-price correction as opposed to an imminent bear market is bolstered by the fact that the U.S. economy remains in reasonably good shape and appears to be in little danger of actually contracting any time soon. Granted, the manufacturing and agricultural sectors are being stressed by the trade war with China. However, as Exhibit 9 shows, the cyclical sectors of real (inflation-adjusted) gross domestic product (GDP) continued to grow at a robust pace year over year through June.
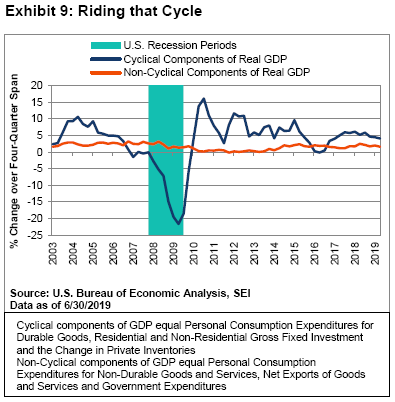
We expect this growth rate to moderate dramatically, perhaps on par with the experience of the 2015-to-2016 period. At that time, the year-over-year percentage change turned slightly negative. The cyclical side of GDP (including consumer spending on durable goods, household and business fixed investment, and the change in business inventories) actually slipped a little in the second quarter from the first quarter of this year and may not have done much better in the quarter recently ended.
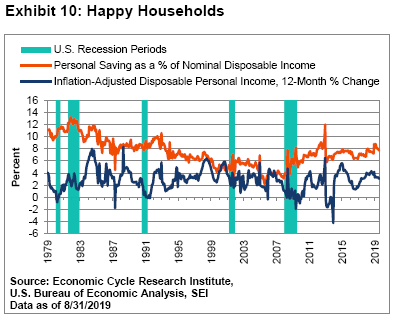
At SEI, we think there is a limit to how far this deterioration in economic activity will go. Few economists, for example, would dispute that the U.S. consumer sector is in great shape. Exhibit 10 highlights the fact that inflation-adjusted after-tax incomes continue to grow at a solid pace. The household saving rate also has been trending higher—in sharp contrast to the steady declines recorded during the 1990s and early 2000s, when home equity loans and other forms of leverage were used to enhance consumer spending. Meanwhile, low interest rates and a reluctance (or inability) to take on mortgage debt have reduced household-debt service costs to their lowest levels since at least 1980.
Although job creation and overall GDP growth has slowed, incomes are still rising. Exhibit 11 illustrates the gain in the share of national income accruing to labour. Total compensation as well as wage and salary income have each increased their share of national income by the equivalent of three percentage points over the past five years. Profit margins, meanwhile, have contracted by a similar degree. Of course, within the historical context of the past 50 years, corporations remain extraordinarily profitable, while labour compensation remains somewhat below the range recorded during the 1970s, 1980s and 1990s.
From an investor’s viewpoint, the rising share of labour income at the expense of corporate profit margins is a mixed blessing. A strong consumer sector should prolong the life of the economic expansion, since personal consumption makes up nearly 70% of GDP. On the other hand, declining profit margins place a speed limit on the growth in earnings.
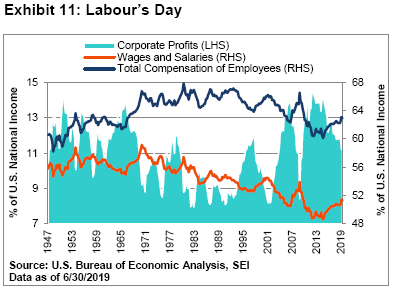
Exhibit 12 is one of our favourite charts. It compares the actual level of the S&P 500 Index (price only) against where the Index would have been at different price-to-forward earnings ratios. Economist Ed Yardeni, who developed the concept for the chart, terms it the “Blue Angels” chart because the different price-to-earnings (P/E) ratios lines “fly” in parallel formation like the famed U.S. Navy flight squadron of the same name, while the S&P 500 Index (price only, depicted here as the blue line with square marks) cuts through the “contrails” of the various P/E ratio levels.
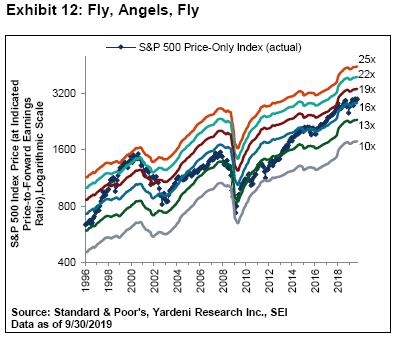
We like this chart because it not only shows how expensive the stock market is now relative to history, but it also provides the current trajectory of forward operating earnings (as projected by bottom-up analysts)—climbing contrails points to rising earnings estimates, thereby supporting a higher stock price at a given P/E ratio.
One can see that the forward-earnings trend has flattened in recent quarters. In September 2018, for example, analysts projected earnings to amount to $174 per share. Fast-forward to this September, and the earnings projection for the next 12 months totals almost $177 (a gain in the projected earnings of only 1.7%). This flattish trend, if sustained, may not bode well for stock prices. Periods of flat-to-down earnings over several quarters occurred in the 2014-to-2015 period, and in 2011, 2007 and 1998. Each coincided with flat-to-declining stock prices, increased volatility and moderate-to-severe market corrections.
As mentioned above, the equity market already sustained a sharp but short drawdown in last year’s fourth quarter. However, the rebound that immediately followed was even stronger, ultimately pushing the S&P 500 Index (price only) to a new all-time high by this July. The earnings multiple, of course, rebounded as well, rising from a reading below 14 times at the December low to more than 17 times at the July high. The P/E on the S&P 500 Index (price only) remains elevated at near 17 times as of September 30, which is just about where it was exactly one year ago. The current reading is close to the average for the past five years (16.5 times) but appreciably above the 10-year average of 14.8 times.
A notable challenge to our sanguine U.S. economic outlook has been oil-price volatility following the mid-September bombing of Saudi Arabia’s largest refinery (which generates half the country’s crude petroleum output). While oil prices spiked in the immediate aftermath of the attack, they have since settled as the Saudis managed to reignite the necessary flow of oil. There remains a concern, however, that oil prices will turn more volatile as tensions between Saudi Arabia and Iran remain elevated.
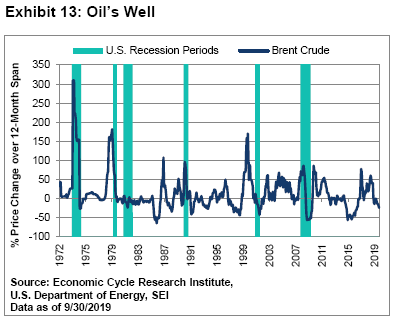
That being said, we do not anticipate a repeat of the 1970s oil shocks that devastated the global economy. In our view, it would probably take an outright war in the Middle East to cause oil prices to jump to the point of causing a U.S. recession. Exhibit 13 shows that economic downturns have occurred in the U.S. when oil prices doubled over a year’s time.
Despite the spike in prices late this quarter, crude oil prices over the 12-month period through September actually dropped by 29%, a boon to U.S. consumers and energy-intensive businesses. Of course, if the confrontation between Iran and Saudi Arabia escalates to a shooting war involving the U.S., the price of oil could reach at least $100 per barrel fairly quickly. Such a shock could possibly tip the world into recession and would be impossible for equity investors to ignore.
As the third quarter came to an end, our optimistic economic viewpoint faced another challenge when the political war in the U.S. between President Trump and congressional Democrats escalated to an official impeachment inquiry. Only the fourth of its kind in U.S. history, the inquiry came upon reports of a whistleblower complaint alleging that Mr. Trump asked Ukrainian President Volodymyr Zelensky to investigate political rival Joe Biden or else lose congressionally-approved financial aid from the U.S. Ongoing investigations into collusion, obstruction of justice and other abuses of power by the president will also continue.
Markets did not react dramatically to the impeachment inquiry announcement, and we believe with good reason. Even if the Democratic-controlled House of Representatives successfully impeaches the president, the Republican-controlled Senate—which ultimately decides whether he is guilty of the impeachment charges presented by the House—is not expected to remove him from office. The Constitution requires a two-thirds supermajority of the Senate, where Republicans hold a 52-42 edge, for removal of a president; there would likely need to be overwhelming evidence of malfeasance, not just a smoking gun, for the upper chamber to convict.
Over the past couple months, one may be surprised that the equity market environment wasn’t more challenged given the backdrop of deteriorating economic and corporate profits, the ratcheting up of tariffs between the U.S. and China, and the rising Middle East tensions. Information technology, the most heavily-weighted sector in the S&P 500 Index (21.5% of the index’s market capitalization as of the end of August), stumbled badly in early August as trade tensions escalated—but the sector has since rebounded. Even though it has the most international exposure as a percentage of revenues, information technology remained the best-performing sector of the S&P 500 Index this year (up 31.4% on a total-return basis).
The consumer discretionary sector (10.2% weight in the S&P 500 Index as of the end of August) also remained near its high for the year to date (22.5% on a total-return basis) despite the severe stress experienced by traditional department store retailers and rising concerns that the imposition of tariffs on all Chinese goods will hurt American consumers more directly than previous increases. The strong trends in employment, incomes and spending continued to outweigh these worries.
More recently, some lagging sectors have staged nice comebacks. Financial stocks (13.1% weight in the S&P 500 Index as of the end of August) moved sharply upward from their end-of-August lows and are now 19.6% higher year to date. The decline in long-term bond yields and a further inversion of the yield curve during the quarter sparked another round of worries that banks would be strained by lower net-interest margins (yields and prices move inversely). Although the sector still lags the S&P 500 Index on a total-return basis in the year to date, the gap has narrowed substantially.
More broadly, there has been a marked sector rotation into the underperformers. The energy, materials and industrials sectors all staged a nice bounce in September following a rough August. However, energy and materials (up 6.0% and 17.1%, respectively) remained well off the 20.6% year-to-date advance of the overall S&P 500 Index. Only the health care sector (14.2% weight in the S&P 500 Index as of August 31) fared worse, with poor performances in managed care, biotech and pharmaceuticals. Much of this underperformance reflects investor uncertainties regarding possible regulatory reforms that may result in government-mandated price controls and additional disruptions to health care insurance markets. While some of these potential reforms have had support across party lines, the chances of meaningful bipartisan action on the health care issue between now and the 2020 elections are probably lower since Democrats initiated a formal impeachment inquiry into the Republican president.
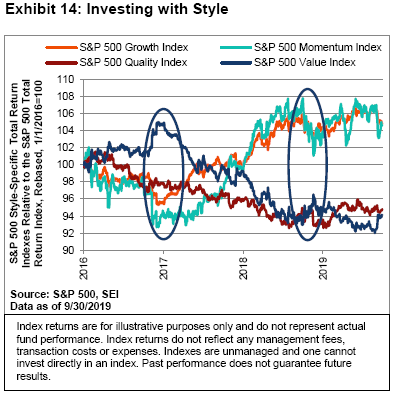
The price reversals within S&P 500 Index sectors also flowed through to investing styles. In Exhibit 8, we track the performance of some style-specific indexes (published by S&P Dow Jones, a division of S&P Global) relative to the S&P 500 Index (total returns). [Note that other organizations, including MSCI and Russell, publish style indexes with similar names. They all have different methodologies and compositions, however, and so are not directly comparable to each other. We use the S&P style indexes in Exhibit 8 because we are focusing on the widely-followed S&P 500 Index.
It’s hard to say at this point whether the reversal will be sustained, although SEI’s equity managers have been positioned for such an eventuality. The ovals in Exhibit 14 are meant to highlight the two periods in the past four years when value stocks sharply outperformed the S&P 500 Index (total returns) and the momentum style underperformed. Those previous reversals were not sustained because economic growth slowed while bond yields declined and the yield curve flattened and inverted. Investors ultimately opted for companies that continued to exhibit relatively strong earnings and cash-flow trends, while avoiding financial stocks (typically the largest component of a value-oriented style index) and companies within other cyclical industries that suffered from slowing sales and weak pricing.
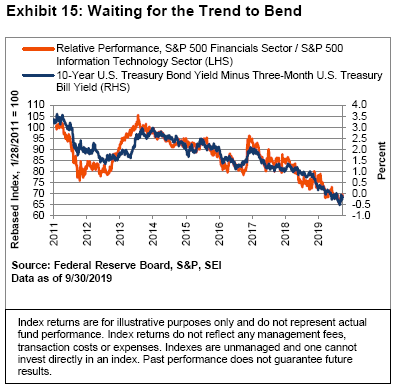
Perhaps the sheer size of the price dispersion will lead to a durable reversal. It would be better if economic growth accelerated and rising bond yields led to a positively sloped Treasury curve. Exhibit 15 shows how close the correlation has been between the yield curve and the relative performance in total-return terms of the S&P 500 Index financials sector versus information technology.
A trade truce between China and the U.S. may prevent the next two rounds of tariff increases from being implemented, but it likely will not bring the combatants back to the status quo ante. To be sure, an agreement to end the tit-for-tat tariffs would be a relief, but it would be only one piece of a larger mosaic that must first come together. Getting the world back on a faster growth track will depend on an economic rebound in the domestic economies of China and Europe.
With regard to SEI positioning, our U.S. large-cap portfolios were tilted toward cyclical value but emphasized higher-quality names. Dividend yields were higher than the dividend yields on the equity benchmark and higher than Treasury yields. The U.S. large-cap portfolios had betas slightly below that of their benchmark. Stable growth stocks were underweighted because such companies represented the most expensive area of the market. Technology issues also continued to be underweighted, primarily due to high valuations but also owing to rising regulatory risks.
SEI’s small-cap equity portfolios were defensively positioned. Growth stocks looked particularly vulnerable and were unrealistically priced, in our opinion. The growth-focused investment managers in our portfolios were more valuation-sensitive as they responded to the market rotation away from the growth and momentum styles.
In fixed income, SEI’s high-yield portfolios remained short duration relative to the benchmarks. Bank-loan exposure was reduced.
China Steps Gently on the Accelerator
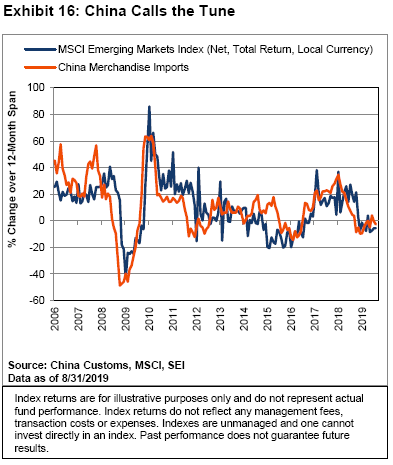
It is still our view at SEI that a near-term recovery in global manufacturing depends on a reacceleration in Chinese economic growth and import demand. The country successfully played the role of economic locomotive in both the 2008-to-2009 and 2015-to-2016 periods, pulling the global economy out of its funk. Exhibit 16 clearly shows that emerging-market equity performance ebbs and flows with China’s demand for imports.
Our expectation of an economic revival in China depends on the assumption that all the fiscal and monetary policy measures put in place over the past year will boost the Chinese economy, overcoming the major challenge posed by its trade war with the U.S. This thesis has been stressed by the heightened trade tensions since May. If the Trump administration actually imposes all the duties on Chinese goods it has announced, the total value of tariffs would amount to almost $120 billion per annum. That works out to an average tariff rate of 20% on Chinese imports into the U.S., still lower than the average 29% rate China imposes on U.S. exports. Most worrisome for the Chinese is that the latest rounds of import duties are aimed at goods like apparel and toys, which usually have thin profit margins, are labour-intensive and can be more easily produced in other low-wage nations than higher-tech products.
We therefore believe that Chinese President Xi Jinping has an incentive to get a deal done with President Trump, even though many other observers would argue that China has the ability to wait and see if Trump gets re-elected next year. The last thing President Xi needs is a sharp rise in unemployment and corporate bankruptcies as profit margins get eviscerated.
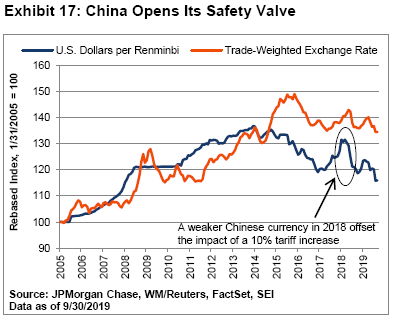
China’s currency has weakened further in recent months, helping to offset some of the impact. As Exhibit 17 highlights, the renminbi (yuan) fell to an 11-year low against the U.S. dollar and a five-year low against a broader basket of currencies in September 2019. The cumulative decline versus the U.S. dollar amounts to 12% since April 2018, offsetting a little more than half of the tariff increases that have been imposed or announced.
The Chinese government, however, is reluctant to encourage additional currency depreciation, fearing that capital could flee the country. Rather, there is evidence that China is getting more aggressive when it comes to pulling monetary and fiscal levers. In recent weeks, bank liquidity was materially enhanced by a sharp cut in required reserve ratios and the government reformed its prime-rate mechanism, a move that should lower the cost of borrowing for corporations.
These measures can be added to the dozens of other actions taken to stimulate growth over the past one-and-a-half years. Taken individually, they appear to be mostly modest tweaks—but they are adding up. It’s true that the Chinese authorities are still refraining from a sharp increase in debt, but Exhibit 18 indicates that broad credit growth (the blue line with diamond markings) has accelerated from a negative year-over-year reading to recent growth in the 20% area as the quarter came to a close. This rebound in credit coincides with a nice recovery in freight transport volumes, while the growth rate in other measures of activity seem to be holding steady around mid-single digits.
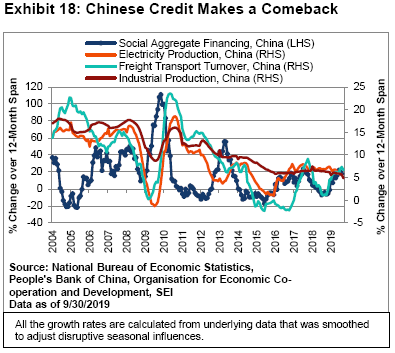
Whether this proves enough to jumpstart global economic growth remains to be seen. All the growth rates in Exhibit 18 are calculated from underlying data that was smoothed to adjust disruptive seasonal influences. The most recent monthly numbers for industrial output, investment and consumer spending all suggest that economic activity softened further in August. China’s official manufacturing purchasing managers index shows that employment has ebbed to its weakest point since the Great Recession of 2008 to 2009.
A truce in the U.S.-China trade war probably will not give a huge boost to global markets, but it could spark a bounce in animal spirits more quickly than China’s current strategy of incremental monetary and fiscal easing. Investors have cheered even minor signs of progress in the trade talks, but the breakdown in the U.S.-China economic relationship looks to be closer to our worst-case scenario than to our previous working assumption. Perhaps there will be some sort of truce, but a rollback of tariffs to lower levels may be a forlorn hope.
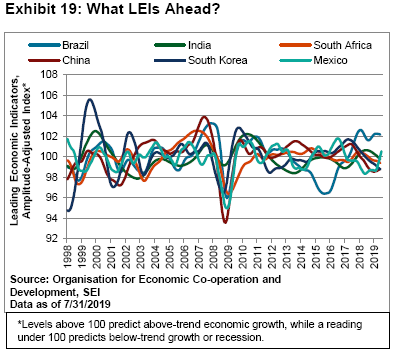
Slowing growth in China, the U.S. and the eurozone does not bode well for other economies. Exhibit 19 highlights the leading economic indicators (LEIs) of China and those of several other important emerging and middle-income countries. Among the countries in the chart, only Brazil and Mexico seem to be growing at an above-trend pace. However, the relatively good performance exhibited by these two countries strikes us as a bit misleading.
Brazil’s real GDP grew approximately 1% between June 2018 and June 2019; although private consumption is rising a tad faster and investment appears to be picking up. At least the country looks likely to keep growing as opposed to falling back into recession. The Brazilian government’s success in passing pension reform is also a big plus, especially for investor sentiment.
Nonetheless, one would expect Brazil to be a big beneficiary of the trade tensions between the U.S. and China, with soybean farmers and energy producers grabbing market share. But this has not happened: Total merchandise exports were down 11% in the 12 months ended August.
The other countries shown in Exhibit 19 have leading economic indicators below the 100 level, meaning they are growing below trend. India, South Africa and Korea continue to see deterioration. China, at least, might be turning the corner.
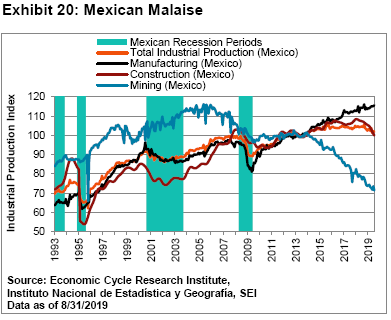
Mexico, meanwhile, registered a year-over-year contraction in its inflation-adjusted GDP. Private consumption expenditures have been slowing for the past two years and probably fell into negative territory in the three months ended June. Gross investment, meanwhile, contracted in six of the past 12 quarters. The immigration crisis at the Mexican-U.S. border and President Trump’s threats in May to slap debilitating tariffs on Mexican exports into the U.S. may have had a negative impact. Unemployment has been on the rise this year, reaching its highest level since January 2016. Manufacturing output remains one of the economy’s bright spots, as noted in Exhibit 20. But total industrial production has been falling, reflecting a sharp pullback in construction and the ongoing decline in the country’s oil industry.
On a positive note, most developing countries have been able to cut interest rates, following the lead of the U.S. Fed and the European Central Bank (ECB). Some 35 lower-income countries have recorded declines in their central banks’ policy rates this year, according to data provided by FactSet. Most of the cuts are of recent vintage, occurring in August and September.
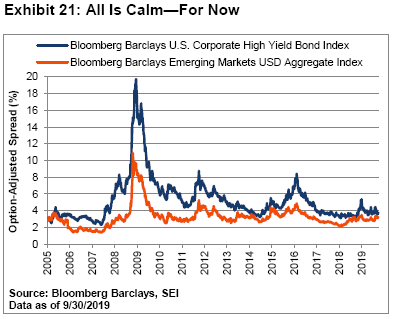
Meanwhile, capital-market conditions in emerging countries still appear benign. Exhibit 21 shows that spreads on U.S. dollar-denominated debt remain in the middle of their range for the past eight years. Spreads moderately increased during the first half of last year, as the U.S.-China trade war heated up. There has been little change since, even though trade uncertainties have worsened. In fact, emerging-market U.S. dollar-denominated debt performed much better than U.S. corporate high-yield debt during the sharp correction in risk assets at the end of last year. But easier credit conditions are a necessary, but hardly sufficient, step toward economic recovery. Better growth in China and developed countries is also essential.
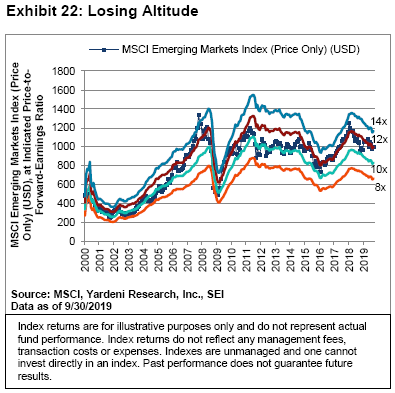
For the near term, we remain cautious on emerging-market equity as an asset class. Exhibit 22 is a “Blue Angels” chart for the MSCI Emerging Market Index (price-only)—which fell more than 25% from January 2018 to its July 2018 low. Since then, there have been a few failed rally attempts. Unfortunately, the trend in estimated 12-month forward earnings has been sharply downward since early 2018. This has resulted in limited improvement in valuations, as measured by the index’s price-to-earnings ratio. As long as the earnings trend is toward the downside, we expect emerging markets will continue to struggle.
This doesn’t mean there are no opportunities in emerging-market equities, however. For example, India’s stock market catapulted higher in mid-September in response to a tax-cut announcement. It remains a relatively poor performer in the year-to-date, however. As is usually the case, SEI’s emerging market portfolios are focused on individual stocks and industries instead of making broad macro bets.
SEI’s emerging-market portfolio remained mostly focused on domestically-oriented companies that should benefit from an expanding middle class of consumers. Major overweights relative to the benchmark included information technology, telecommunications and energy. Financials and materials were the biggest underweights. Regionally, our portfolio continued to underweight Asia, Africa and the Middle East, while Latin America was overweight.
A (Dis) United Kingdom and a Continental Divide
It is no secret that U.S. equities have performed better than other developed markets since the global financial crisis 11 years ago. This relative outperformance, however, extends much further back in time. Since 1988, the MSCI USA Index (net, total returns) appreciated more than 23 times, while the MSCI World ex USA Index (Net) recorded a cumulative net total return over the period that amounted to less than six times in U.S. dollar terms. The only extended period during which U.S. equities lagged other developed markets occurred from mid-2003 to the fall of 2007, due mostly to the 30% decline of the U.S. currency over that time span.
Focusing in on the year-to-date, the U.S. market has continued to be a relative winner, with the MSCI USA Index (net, total returns) gaining 20.6% through the end of September. By contrast, the MSCI World ex USA Index (net, total returns) is up only 14.1% in U.S. dollar terms; this absolute performance is better (up 16.4%) when measured in local currency terms.
Despite all its economic and political problems, European-wide equity markets have done rather well this year in local-currency terms. The MSCI Europe ex UK Index (net, total returns) climbed 21.1% year to date, actually matching that of the MSCI USA Index. The MSCI United Kingdom Index (net, total returns) was the laggard, gaining only 13.8%—still something of an achievement considering the messy political situation in the U.K. and the ongoing possibility of a no-deal Brexit.
How does one explain the rather robust performance of the MSCI Europe ex UK Index this year? To a large extent, TINA (“There Is No Alternative”) comes into play. The MSCI Germany Index (net, total returns) is up 16.1% in local-currency terms and 10.7% in U.S. dollars as of September 30. While this performance lags the MSCI Europe ex UK Index, it is still a solid gain when viewed against the country’s deteriorating economic performance.
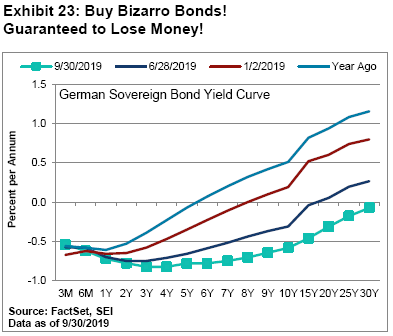
Exhibit 23 shows that Germany’s sovereign yield curve now is negative across the maturity spectrum, all the way up to 30 years. Just one year ago, yields were still positive beyond six years. Germany’s investors do not have any hope of building wealth in less risky fixed-income assets. They are forced into equities and other risk-oriented investments, such as high-yield debt and precious metals. Of course, investors globally face similar challenges, if not quite to the same extent.
Germany’s economic backdrop, however, is going downhill rather dramatically. Exhibit 24 tracks the industrial output of the largest European countries, and includes the U.S. for reference. The U.S. and German industrial sectors have performed better than France, Italy, Spain and the U.K. since 2008, with the U.S. making a post-crisis high in 2014 and Germany following in late 2015. The U.K. and France represent a second tier, with industrial output still below the end-of-2007 levels by roughly 7%. Italy and Spain compose a third tier that fell sharply during the crisis, recovered only modestly during the early phase of expansion, and relapsed into recession during the periphery crisis of from 2011to 2012. Industrial output in each of these two countries remains about 20% below their respective end-of-2007 levels.
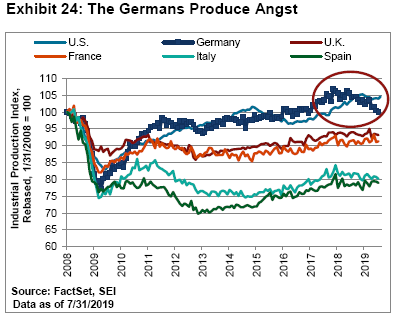
It is Germany, however, that looks like the Sick Man of Europe, a moniker it first acquired during the 1990s when the country struggled to integrate the former East Germany into itself. While Germany’s overall economy is not clearly in a recession, its manufacturing sector almost certainly is. Indeed, the 6.4% decline in German industrial production from the peak in November 2017 through July 2019 is worse than Italy’s 2.5% contraction over the same time frame.
Problems in the auto industry spawned by the diesel-emissions scandal and the regulatory aftermath may have sparked the slide initially—but now Germany’s industrial base is being victimized by the U.S.-China trade war and China’s sharp slowing in overall economic growth, particularly a waning demand for cars. Since manufacturing represents almost 23% of the German economy’s GDP (a much higher share than the 14% average for Organisation for Economic Co-operation and Development member countries), it is easy understand why the country is in an economic funk.
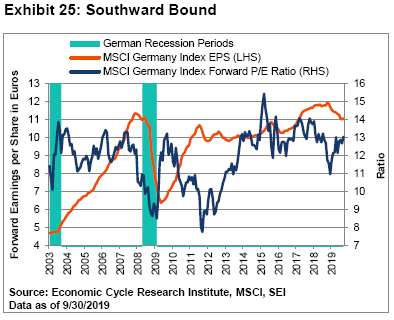
Exhibit 25 shows that forward earnings estimates for the companies that comprise the MSCI Germany Index have been in decline since the end of 2018. The pullback to date has been mild compared to the one that occurred during the global financial crisis and recession, but it is certainly worse than that which it experienced during the European periphery debt crisis or the global manufacturing slowdown of 2015 to 2016. Meanwhile, the aggregate price-to-earnings ratio (currently 13.0 times) still appears somewhat elevated versus its average value of 11.9 times from 2003 through the year to date.
The angst in Germany over the country’s manufacturing recession has raised the possibility that the country’s politicians will finally begin to view an expansionary fiscal policy in a more sympathetic light. Exhibit 26 compares the net borrowing and lending undertaken by the governments in some of the major economies of Europe. We include the U.S. for comparative purposes.
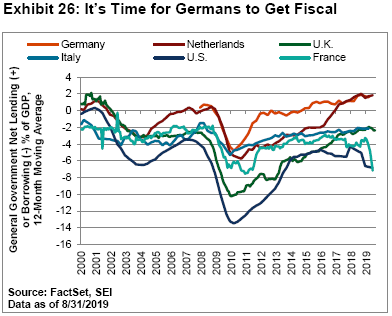
Note that the data presented in the chart are a more comprehensive measure of governments’ budget balances. They include the fiscal balances at all levels of government. They also take into account government fixed-investment spending, net of capital consumption (depreciation). On this basis, Germany’s government sector has a surplus (along with the Netherlands), and is currently a net lender to the private sector to the tune of 1.6% of GDP. By contrast, the general government sector in the U.S. has been a relatively large net borrower for many years, averaging almost 7% of GDP over the 12-months ending June. France, meanwhile, has seen its budget balance turn deeply negative, with taxes being cut and investment spending increasing in the aftermath of “yellow-vest” protests against the so-called establishment earlier this year.
Outgoing ECB President Mario Draghi has been highlighting the need for fiscal-policy expansion in the eurozone. This is sure to be a talking point taken up by his successor Christine Lagarde in the months to come. The reality, which Draghi dare not say, is that monetary policy is not delivering on its promise to jumpstart eurozone economic growth or raise inflation closer to its target level.
At its September meeting, the Governing Council of the ECB voted to restart quantitative easing, promising to buy €20 billion of government securities per month. That amount is greater than the current euro-area government bond issuance total average of €15 billion per month. This program is supposed to extend indefinitely, but country-specific issuer limits on the amount of debt that can be bought means that purchases may need to be curtailed within a year unless the rules are changed. That said, the ECB is basically inviting governments to borrow at negative and near-zero interest rates. We see this as an important incremental positive for eurozone growth, but not exactly a game-changer in the near term. Germany may need to endure more economic pain before it tries to find a way to loosen the fiscal purse strings enough to make a difference.
The Continent, especially Germany, would likely benefit if China revved up its economy like it did three years ago, but that is outside Europe’s ability to influence. Europe also needs to avoid its own trade war with the U.S. This may might be too difficult as well. President Trump has been quiet on the subject lately, but he could start taking Twitter shots at the EU’s unfair trading practices at any time. Perhaps of more importance, the Brexit battle could enter its final stages in the weeks immediately ahead—and to that we now turn our attention.
The Beast of Brexit
The Brexit saga seems to just keep going and going. We will find out soon, however, whether a no-deal exit from the EU actually takes place or is delayed (for a third time) beyond the October 31 deadline. The political carnage caused by Brexit is already breathtaking. Two Conservative Prime Ministers (David Cameron and Theresa May) have already fallen since the referendum vote three years ago; current Prime Minister Boris Johnson could become the third casualty. The Conservatives have lost their working majority in Parliament following the expulsion of 21 members of Parliament from the party in the aftermath of a vote to wrest away Brexit negotiations from the government. Even the Prime Minister’s brother Jo Johnson stepped down from his post as a government minister in protest.
The battle between the Prime Minister and Parliament has led to a constitutional crisis. Johnson’s move to suspend Parliament has been declared invalid by the U.K. Supreme Court, throwing the government’s Brexit strategy into disarray. If Johnson defies the will of Parliament and takes the U.K. out of the EU without a trade agreement or parliamentary approval, that crisis will deepen. More likely, there will be an additional delay, with a new Brexit deadline of January 31. That would allow for a general election and, hopefully, a new mandate from the electorate. Yet, the political landscape in Great Britain is in flux as the Brexiteers and Remainers fight it out. The Tories are badly split and the Labour Party under Jeremy Corbyn is unpopular. The Liberal Democrats and Nigel Farage’s Brexit Party are making the most of the situation. The outcome of the next election could be an unstable coalition.
Uncertainty surrounding Brexit has depressed business investment in the U.K. It also has led to wild swings in inventories and imports; companies built up their stocks of goods as a precautionary measure earlier this year ahead of the first deadline. When the first Brexit deadline of March 29, 2019, was extended, those inventories were allowed to run off, causing U.K. GDP to decline in the second quarter this year.
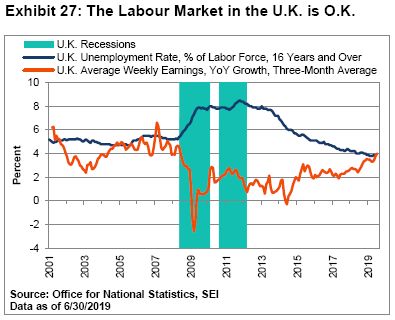
Household consumption still looks to be solid enough, growing at about a 2% annual rate. As shown in Exhibit 27, the headline unemployment rate in the U.K. fell below 4% in December and has stayed below that level, with the latest reading (in June) at 3.8%.
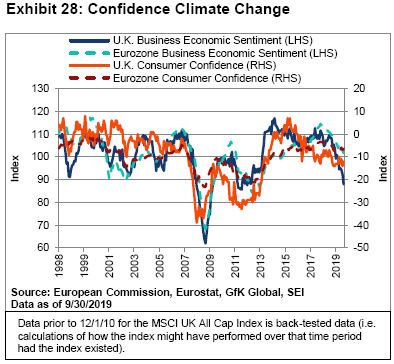
Despite the rather solid financial position of households, Exhibit 28 shows that confidence has been on the decline for U.K. consumers and businesses. In fact, both consumer and business confidence are nearing levels consistent with recession. Confidence measures in the eurozone, while off the highs of 2017, have not fallen to same degree. Brexit uncertainty is an aggravating factor for the U.K., but optimism actually was on the wane well before the referendum vote in June 2016.
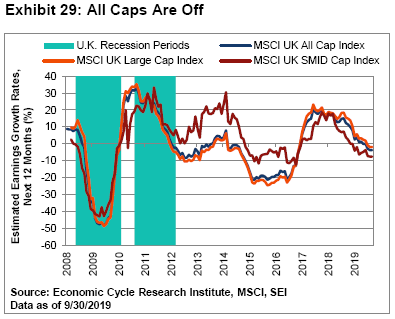
U.K. security analysts also appear grumpy. Exhibit 29 highlights their increasingly dour view of U.K.-based companies’ earnings prospects. Following their strong recovery out of the 2015-to-2016 slow down, forward earnings estimates have been cut on a consistent basis over the past two years. Small- and mid-cap companies’ earnings-per-share estimates have been pared more sharply than those of large-cap companies; but even larger, globally focused companies are expected to endure outright declines in profitability in the year ahead. While relatively low equity-market valuations and historically low interest rates have helped keep stock prices aloft, the earnings trend is certainly problematic. SEI’s portfolios have a neutral view toward European and U.K. equities. Valuations are considered fair, but the trajectory of earnings and the macroeconomic backdrop are areas of concern. From an alpha source perspective, there was a strong reversal in September, but this has not been enough to change the overall outlook. Value stocks remain attractive in our view. Our portfolios favoured commodity sectors and financial stocks, and were underweight technology and quality/defensives (especially consumer staples and health care).
Our bond portfolios were caught off guard by the strength of the bond rally in August, but changes made earlier in the summer reduced their pro-cyclical bias and helped limit performance lag. Our general view remains that yields are too low relative to fundamentals (which are admittedly deteriorating). We believe term structures in core Europe, the U.K. and Japan offer particularly poor value.
Japan: Taxing Times
While Europe and the U.K. deal with Brexit and Germany’s near-recession, Japan is focused on its own home-grown uncertainty: The consumption tax hike became effective October 1. The rate jumped to 10% from 8% that day, although (as with all consumption and value-added taxes) there are exceptions, carve-outs and buyer incentives aimed at reducing the negative impact on big-ticket items like autos and homes.
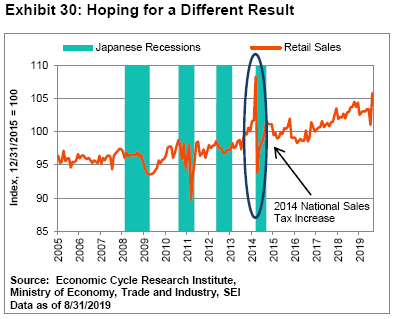
The last time Japan’s consumption tax went up (from 5% to 8% on April 1, 2014), retail sales plummeted, the yen strengthened (hurting Japanese exports), and the Japanese stock market struggled for the next two years. Exhibit 30 highlights the anticipatory retail buying that took place just ahead of the previous rate hike in 2014, and the subsequent crash. Excluding those extreme movements, retail sales stumbled along for a few years before enjoying a more notable gain in 2017 and 2018. This year, there has been a similar surge in August. September probably recorded a further sales jump. A big pullback in household purchases in October appears inevitable.
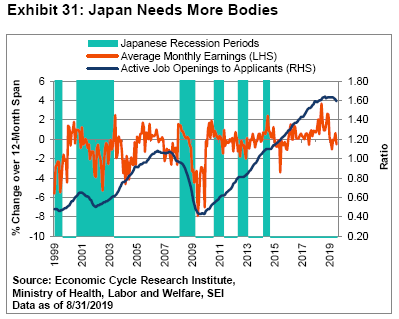
As Exhibit 31 shows, the job market in Japan remains tight. Available jobs per applicant continue to hover near a record high, but there has been a modest easing of the imbalance this year. The decline in earnings growth from last year, however, is surprisingly steep. Despite all their efforts, Prime Minister Shinzo Abe’s government and the Bank of Japan have been unable to spur a lasting reflation of the economy.
For the most part, activity in most sectors of the economy has meandered around a 1% growth trend. On a per-capita basis, inflation-adjusted GDP has increased about 1.5% per annum when measured from the recession low of March 2009. However, when using the peak of the previous cycle (March 2008) as the starting point, per-capita real GDP has grown a mere 0.7% on an annual basis.
Like Germany, Japan has been hurt by the slowing growth of China and the general malaise affecting Asia as whole. Merchandise exports to China from Japan (calculated as a six-month moving average) have declined 14% through August. For Asia as a whole, the decline amounts to almost 11%.
To make matters worse, Japan’s political relationship with South Korea has frayed badly in recent months upon the reopening of emotional wounds stemming from World War II. This political animosity has bled into their economic relationship. Both countries have expanded economic sanctions, including tit-for-tat tariff duties, import and export bans, and consumer boycotts. Even more worrisome is the breakdown in direct military intelligence sharing at a time when China is pushing its weight around in the East and South China Seas.
In all, Japan’s outlook appears to be one of stasis. Monetary and fiscal policy should remain extremely accommodative in the hope that the economy finally gains some traction. Like the rest of the world, however, Japan’s economy would benefit more from a resurgence in China’s growth and a general easing of trade tensions. In the meantime, investors will likely continue to view the Japan as a safe haven owing to its low volatility. We believe the yen will remain well-bid under this scenario.
Our equity portfolios in the region remained biased to value stocks and were exposed to momentum. Quality and stability were underweighted.
Don’t Just Do Something—Stand There!
Predicting the future is a hazardous venture most of the time. In view of the uncertainties facing investors presently, the prediction game is, arguably, even more challenging than usual. Accordingly, as always, we believe in a diversified approach to investing. Although maintaining exposure to equities and other risk-oriented assets can at times feel uncomfortable, it is our view that investors with long time horizons should avoid timing the market or making outsized sector or regional bets. We think it is best not to assume, for example, that the S&P 500 Index and growth stocks will always be the only games in town. The recent volatility and sharp style rotations in the past quarter should serve as reminders that trends do not last forever. When dealing with a mule market, try to avoid getting kicked in the face.
Glossary
Alpha source is a term used by SEI as part of our internal classification system to categorize and evaluate investment managers in order to build diversified fund portfolios. An alpha source is the investment approach taken by an active investment manager in an effort to generate excess returns. Another way to define an alpha source is that it is the inefficiency that an active investment manager seeks to exploit in order to add value.
Breakeven inflation refers to the average annual rate of inflation over the term of an inflation-indexed bond that would provide the same return as a non-inflation indexed bond. It is calculated by taking the difference between the nominal yield of a conventional Treasury bond and the real yield of an inflation-linked Treasury bond of the same maturity.
Beta is a measure of sensitivity to movements in the market. High beta stocks are more sensitive to movements in the broad market. Low-beta stocks are less sensitive.
Cash flow per share is a measure used to gauge a company’s financial strength and is calculated by its per-share after-tax earnings plus depreciation.
Cyclical sectors, industries or stocks are those whose performance is closely tied to the economic environment and business cycle. Cyclical sectors tend to benefit when the economy is expanding.
Duration is a measure of a security’s price sensitivity to changes in interest rates. Specifically, duration measures the potential change in value of a bond that would result from a 1% change in interest rates. The shorter the duration of a bond, the less its price will potentially change as interest rates go up or down; conversely, the longer the duration of a bond, the more its price will potentially change.
Idiosyncratic refers to characteristics that are unique or specific to a person or entity.
Momentum refers to the tendency of assets’ recent relative performance to continue in the near future.
Price-to-earnings ratio (P/E): The P/E ratio is equal to a company’s market capitalization divided by its after-tax earnings. The higher the P/E ratio, the more the market is willing to pay for each dollar of annual earnings.
Spread is the additional yield, usually expressed in basis points (one basis point is 0.01%), that an index or security offers relative to a comparable duration index or security (the latter is often a risk-free credit, such as sovereign government debt). A spread sector generally includes non-government sectors in which investors demand additional yield above government bonds for assumed increased risk.
Stability refers to the tendency of low-risk and high-quality assets to generate higher risk-adjusted returns.
Value refers to the tendency of relatively-cheap assets to outperform relatively-expensive assets.
Index Definitions
Bloomberg Barclays U.S. Corporate High Yield Bond Index: The Bloomberg Barclays U.S. Corporate High Yield Bond Index is designed to measure the performance of the USD-denominated, high-yield, fixed-rate corporate bond market.
Bloomberg Barclays Emerging Markets USD Aggregate Index: The Bloomberg Barclays Emerging Markets USD Aggregate Index is designed to measure the performance of USD-denominated debt from sovereign, quasi-sovereign and corporate emerging-market issuers.
China’s National Bureau of Statistics official manufacturing PMI: China’s official manufacturing PMI measures the performance of the country’s manufacturing sector and is biased toward larger, state-owned enterprises.
China’s Purchasing Managers’ Index: China’s Caixin Manufacturing Purchasing Managers' Index measures the performance of the country’s manufacturing sector, based on a survey of 430 private industrial companies.
Eurozone Consumer Confidence Index: In the Eurozone, the Consumer Confidence Index measures the level of optimism that consumers have about the economy. The survey is made by phone and covers 23 000 households in the Euro Area. The number of households sample varies across the zone. The questions focus on current economic and financial situation, savings intention as well as on expected developments regarding: consumer price indexes, general economic situation and major purchases of durable goods.
Eurozone Business Economic Sentiment Index: In the eurozone, the Business Sentiment Index measures the current situation of the businesses and its future prospects. The survey is made by phone and covers 23 000 companies in the Euro Area. The questionnaire focuses on: production trends in recent months, order books, export order books, stocks and production expectations. The indicator is computed through the estimation of a factor-model and summarises the common information contained in the surveys.
Industrial Production Index: The industrial production index is a monthly economic indicator measuring real output in the manufacturing, mining, electric and gas industries, relative to a base year.
MSCI Canada Index: The MSCI Canada Index is a free float-adjusted market-capitalization-weighted index designed to measure the performance of the large- and mid-capitalization segments of the Canadian equities market.
MSCI Emerging Markets Index: The MSCI Emerging Markets Index is a free float-adjusted market-capitalization-weighted index designed to measure the performance of global emerging-market equities.
MSCI Europe ex UK Index: The MSCI Europe ex UK Index is a free float-adjusted market-capitalization-weighted index that captures large- and mid-cap representation across 14 developed-market countries in Europe (Austria, Belgium, Denmark, Finland, France, Germany, Ireland, Italy, the
Netherlands, Norway, Portugal, Spain, Sweden and Switzerland). The Index covers approximately 85% of the free float-adjusted market capitalization across European developed markets excluding the U.K.
MSCI Germany Index: The MSCI Germany Index is designed to measure the performance of the large and mid-cap segments of the German market. The index covers about 85% of the equity universe in Germany.
MSCI UK All Cap Index: The MSCI UK All Cap Index is designed to measure the performance of the large-, mid-, small- and micro-cap segments of the U.K. market. The Index covers approximately 99% of the free float-adjusted market capitalization in the U.K.
MSCI UK Large Cap Index: The MSCI UK Large Cap Index is designed to measure the performance of the large-cap segment of the U.K. market. The Index covers approximately 70% of the free float-adjusted market capitalization in the U.K.
MSCI UK SMID Cap Index: The MSCI UK SMID Cap Index is designed to measure the performance of the mid and small-cap segment of the U.K. market. The Index covers approximately 28% of the free float-adjusted market capitalization in the U.K.
MSCI United Kingdom Index: The MSCI United Kingdom Index is designed to measure the performance of the large- and mid-cap segments of the U.K. market. The Index covers approximately 85% of the free float-adjusted market capitalization in the U.K.
MSCI USA Index: The MSCI USA Index is designed to measure the performance of the large- and mid-cap segments of the U.S. market. The Index covers approximately 85% of the free float-adjusted market capitalization in the U.S.
MSCI World ex USA Index: The MSCI World ex USA Index is designed to measure the performance of the large- and mid-cap segments of 22 out of 23 developed-market countries (not including the U.S.).
OECD Composite Leading Indicator Index (CLI): The OECD CLI is used to measure turning points in the business cycle. The metric looks at qualitative data on short-term economic movements. It is used to predict the direction of global economic movements in future months and is published by the Organisation for Economic Co-operation and Development.
Personal Consumption Expenditures (PCE) Index: The personal consumption expenditure measure is the component statistic for consumption in gross domestic product collected by the United States Bureau of Economic Analysis. It consists of the actual and imputed expenditures of households and includes data pertaining to durable and non-durable goods and services.
Purchasing Managers' Index (PMI): The PMI is an indicator of economic health for manufacturing and service sectors. Its purpose is to provide information about current business conditions to company decision makers, analysts and purchasing managers.
S&P 500 Index: The S&P 500 Index is an unmanaged, market-weighted index that consists of 500 of the largest publicly-traded U.S. companies and is considered representative of the broad U.S. stock market.
S&P 500 Growth Index: The S&P 500 Growth Index measure growth stocks using three factors: sales growth, the ratio of earnings change to price, and momentum. S&P Style Indices divide the complete market capitalization of each parent index into growth and value segments. Constituents are drawn from the S&P 500.
S&P 500 Momentum Index: the S&P 500 Momentum Index is designed to measure the performance of securities in the S&P 500 universe that exhibit persistence in their relative performance.
S&P 500 Quality Index: the S&P 500 Quality Index is designed to track high quality stocks in the S&P 500 by quality score, which is calculated based on return on equity, accruals ratio and financial leverage ratio.
S&P 500 Value Index: the S&P 500 Value Index measures value stocks using three factors: the ratios of book value, earnings, and sales to price. S&P Style Indices divide the complete market capitalization of each parent index into growth and value segments. Constituents are drawn from the S&P 500.
U.K. Consumer Confidence Index: In the United Kingdom, the consumer confidence survey measures the level of optimism that consumers have about the performance of the economy in the next 12 months. The GfK Consumer Confidence is derived from the survey of about 2,000 consumers which are ask to rate the relative level of past and future economic conditions including personal financial situation, climate for major purchases, overall economic situation and savings level.
U.K. Business Economic Sentiment Index: In the United Kingdom, the Business Optimism Index is published by the Confederation of British Industry's in its Industrial Trends Survey. An average of 400 small, medium and large companies from the manufacturing sector is surveyed each quarter. The Questionnaire accesses the overall sentiment regarding general and export business situation, investment, capacity, order books, employment, output, stocks, prices competitiveness regarding domestic, EU and non-EU markets and innovation and training.
Important Information
SEI Investments Canada Company, a wholly owned subsidiary of SEI Investments Company, is the Manager of the SEI Funds in Canada.
The information contained herein is for general and educational information purposes only and is not intended to constitute legal, tax, accounting, securities, research or investment advice regarding the Funds or any security in particular, nor an opinion regarding the appropriateness of any investment. This commentary has been provided by SEI Investments Management Corporation (“SIMC”), a U.S. affiliate of SEI Investments Canada Company. SIMC is not registered in any capacity with any Canadian regulator, nor is the author, and the information contained herein is for general information purposes only and is not intended to constitute legal, tax, accounting, securities, or investment advice, nor an opinion regarding the appropriateness of any investment. You should not act or rely on the information contained herein without obtaining specific legal, tax, accounting and investment advice from qualified professionals. This information should not be construed as a recommendation to purchase or sell a security, derivative or futures contract. You should not act or rely on the information contained herein without obtaining specific legal, tax, accounting and investment advice from an investment professional. This material represents an assessment of the market environment at a specific point in time and is not intended to be a forecast of future events, or a guarantee of future results. There is no assurance as of the date of this material that the securities mentioned remain in or out of the SEI Funds.
This material may contain "forward-looking information" ("FLI") as such term is defined under applicable Canadian securities laws. FLI is disclosure regarding possible events, conditions or results of operations that is based on assumptions about future economic conditions and courses of action. FLI is subject to a variety of risks, uncertainties and other factors that could cause actual results to differ materially from expectations as expressed or implied in this material. FLI reflects current expectations with respect to current events and is not a guarantee of future performance. Any FLI that may be included or incorporated by reference in this material is presented solely for the purpose of conveying current anticipated expectations and may not be appropriate for any other purposes.
There are risks involved with investing, including loss of principal. Diversification may not protect against market risk. There may be other holdings which are not discussed that may have additional specific risks. In addition to the normal risks associated with investing, international investments may involve risk of capital loss from unfavourable fluctuation in currency values, from differences in generally accepted accounting principles or from economic or political instability in other nations. Emerging markets involve heightened risks related to the same factors, in addition to those associated with their relatively small size and lesser liquidity. Bonds and bond funds will decrease in value as interest rates rise.
Information contained herein that is based on external sources is believed to be reliable, but is not guaranteed by SEI Investments Canada Company, and the information may be incomplete or may change without notice.
Commissions, trailing commissions, management fees and expenses all may be associated with mutual fund investments. Please read the prospectus before investing. Mutual funds are not guaranteed, their values change frequently and past performance may not be repeated.


