Economic Outlook: A Long and Disrupted Road to Recovery?
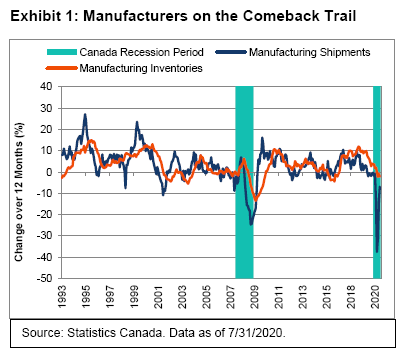
Although Canada experienced a sharp contraction in overall business activity between February and April this year, it has since enjoyed an equally sharp snapback. The recovery in manufacturing has been aided especially by the economic rebound in the U.S. and the resurgence in demand for autos and metals.
Exhibit 1 highlights the V-shaped rebound in manufacturing shipments. At the worst point of the recession on April 30, manufacturers reported a 37.5% year-over-year collapse in shipments—sharper than any year-over-year contraction recorded during the global financial crisis. By July, that year-over-year shortfall shrank to 6.9%. The decline in inventories has been minimal compared with the dramatic drop in shipments earlier this year, which may temper the recovery heading into the year-end.
A possible resurgence in coronavirus cases also could short-circuit the recovery. Infection rates are climbing, largely in and around the same major metropolitan areas that saw surges in the spring; regions that did not report many cases in the first wave of the pandemic are now experiencing more serious outbreaks. Currently, the hottest spots include northern Alberta and the Edmonton region; areas around Quebec City and up the St. Lawrence River, along with the Gatineau region; the Vancouver area of British Columbia; and in Ontario, Toronto and Ottawa.
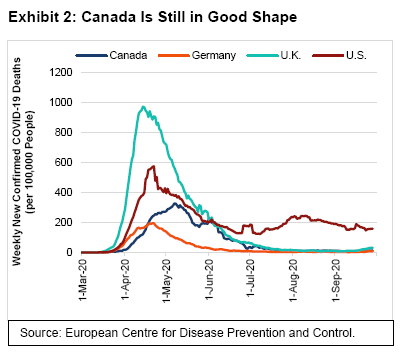
Although rising infection rates may necessitate school closures and restraints on mobility, any lockdowns will likely be localized and less draconian than those imposed earlier this year. Exhibit 2 tracks the number of newly confirmed COVID-19-related deaths in Canada, the U.S., the U.K. and Germany, adjusted for each country’s population. Canada has suffered far fewer fatalities than the U.S. or the U.K. It has recorded a steady, relatively low rate of 13 deaths per 100,000 population since July, similar to those recorded in the U.K. and Germany. In contrast, the U.S. is still reporting a weekly death rate of 150 per 100,000.
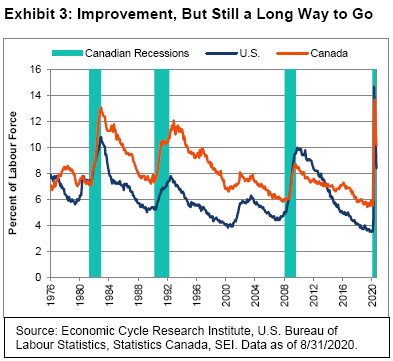
After peaking at 13.7% in May, Canada’s unemployment rate fell three consecutive months to 10.2% in August. As Exhibit 3 shows, the Canadian measure is closely tracking that of the U.S., although the latter continues to run almost two percentage points lower (as it has for the last couple of years). Those on temporary layoff totaled 200,000 in August, down from an April peak of 1.3 million. Roughly one million people are reported as being permanently laid off, a considerable improvement on the 1.6 million jobs lost in April. It likely surprises no one that employment in accommodation and the food services, culture and recreation, and the transportation and warehousing sectors are still 10% or more below their pre-pandemic levels.
The Bank of Canada has tended to downplay the recovery, much like officials at the U.S. Federal Reserve (Fed) have been doing. We believe the odds are high that the central bank will keep its target rate at 0.25% (the same level as the U.S. fed-funds rate) well into 2023. There is no expectation that inflation will accelerate in a worrisome way until most of the economic slack created by the pandemic is absorbed.
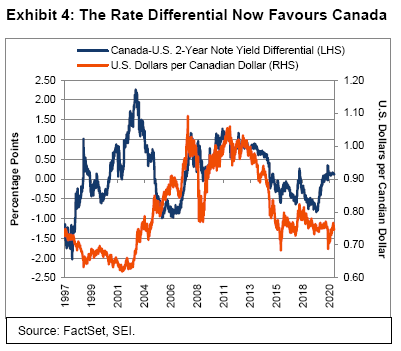
Although yields have fallen, the two-year note interest-rate differential with the U.S. has narrowed considerably over the past 18 months, from a negative 0.84 percentage points to a positive 0.13 basis points at the end of September. This should make Canadian fixed-rate assets more attractive to international investors. Exhibit 4 highlights the positive correlation that exists between the Canada-U.S. interest-rate differential and movements in the Canada-U.S. exchange rate. The correlation isn’t perfect (while positive, it is less than one), the relationship suggest that the loonie could strengthen further—especially if the global economy continues to improve and commodity prices move higher.
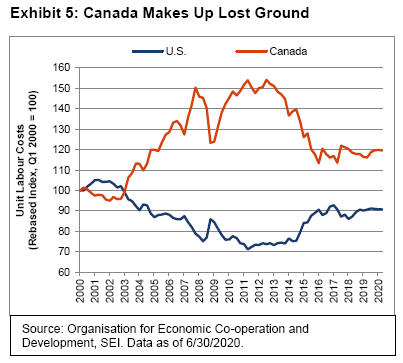
A strong Canadian dollar does have its drawbacks, particularly as the country has struggled to improve its competitiveness over the years. When the loonie is strong, unit labour costs tend to increase rapidly—which causes the country’s competitiveness to suffer. As illustrated in Exhibit 5, the gap between Canadian and U.S. unit labour costs has been much narrower in recent years thanks to the loonie’s depreciation. We think the federal government’s actions to combat the virus and the longer-term political priorities of Prime Minister Justin Trudeau’s government will widen the competitiveness gap once again.
On September 23, the Governor General of Canada delivered the Speech from the Throne to open a new parliamentary session and outline the Trudeau government’s agenda—which has four formal themes: (1) Fight the pandemic and save lives; (2) Support people and businesses as long as it lasts; (3) Build back better to create a stronger, more resilient Canada; and (4) Stand up for who we are as Canadians. The agenda has already gained the backing of the New Democratic Party, and will thus form the basis for the next budget to be presented in November or December.
In our view, the Trudeau government will do whatever it takes to support households and businesses through the pandemic. It intends to extend the Canada Emergency Wage Subsidy to next summer (currently scheduled to expire in December). Additional support will also be given to small businesses through the Canada Emergency Business Account. The Throne Speech also called for the creation of one million new jobs with a focus on environmental sustainability. Additionally, it noted unspecified, costly commitments to social priorities including higher childcare spending and subsidies for pharmaceutical purchases.
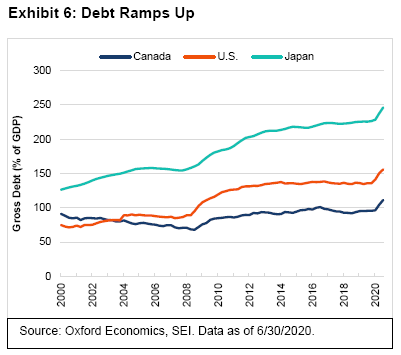
Exhibit 6 shows that gross government debt as a percent of gross domestic product (GDP) has swung acutely higher in Canada over the past two quarters, just as it has for other countries. Government debt-to-GDP still runs below that of the U.S., and dramatically so versus Japan. Nonetheless, the plan put forth by the Trudeau government implies that the debt burden will continue to rise at a sharp clip in the years immediately ahead.
Regime Change
It has been an eventful and exhausting year. With three months to go, there will be no rest for the weary. Not only is the novel coronavirus still with us, but a second wave of infections has already emerged in parts of the world and threatens to hit the Northern Hemisphere hard during the fall and winter. Economically, the course of the virus (which causes the disease COVID-19) continues to influence the path of the global recovery. Election-year politics in the U.S., meanwhile, have amped up an already-heightened level of social discord, complicating the medical and fiscal responses to the pandemic. Outside of the U.S., many developed and emerging economies remain under stress despite rebounds from recent lows in business activity in many countries. The U.K. has the added burden of Brexit concerns, which have returned as the deadline nears for the country to reach a deal with the EU about the terms of their relationship. In Japan, Prime Minister Shinzo Abe resigned in August, perhaps ending a relatively long period of political and policy certainty in the country. Relations between China and the U.S. continue to deteriorate over disputes about trade, Hong Kong, human rights, territorial reach and cybersecurity.
We sense that the next few months could prove critical to the future course of the global economy and financial markets. Recent and anticipated regime changes taking place in distinct but connected universes—including political, economic, medical and financial spheres— will likely come into play. Specifically, the change in the Fed’s monetary framework, the impact stemming from the successful creation of virus vaccines, the response of governments to the impairment of their fiscal positions and the results of the U.S. election are all intertwined.
Digging out of a deep economic hole
Exhibit 7 provides a broad sampling of the economic devastation around the globe caused by the pandemic, as measured by selected countries’ real (inflation-adjusted) GDP; the chart plots both the year-over-year change through June 30, 2020, as well as the expected outcome for full-year 2020.
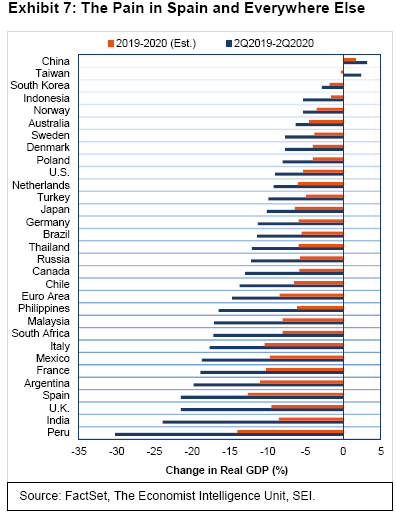
Among developed economies, Europe (where growth had already been quite sluggish prior to virus-related disruptions) has been hit hard by the pandemic. Over the four-quarter period, the sharpest contractions in business activity among European countries were the U.K. (-21.5%), Spain (-21.5%), France (-18.9%) and Italy (-17.7%)—all of which are expected to register the biggest calendar-year declines as well. The Nordic economies have held up much better—owing to less stringent lockdowns in Demark (-7.7%) and Norway (-5.3%), and virtually no mandated shutdowns in Sweden (-7.7%). (Sweden ended up with one of the highest death rates adjusted for population to date, on par with the U.S. and only slightly better than the U.K.) In North America, real GDP in the U.S. fell 9.0% over the four quarters ending June 30, closer to the performance of the Nordic countries and the Netherlands than that of larger European countries, while Canada’s 13% contraction was more European-like.
Emerging economies did not escape the economic carnage. Contractions have been truly stunning in Peru (-30.2%), India (-23.9%), Argentina (-19.8%) and Mexico (-18.7%). Only in Asia can one find pockets of resilience: China (+3.2%) and Taiwan (+2.4%) were the only countries in the world to post positive year-over-year gains through the second quarter. China also is the only country to post a gain in the second quarter itself, after having lagged the rest of the world in the prior quarter due to having the most stringent lockdown during that period.
South Korea (-2.8%), Indonesia (-5.3%) and Australia (-6.3%), aided by China’s second-quarter recovery, posted only moderate declines in GDP over the four-quarter period. These countries also contained the virus to a more manageable degree than many other parts of the world. Japan (-10.1%) appears to be the major underperformer in the region. One would have expected the Japanese economy to benefit from the spillover of China’s economic bounce, as the two countries are large trading partners and Japan has had a relatively mild COVID-19 infection rate. Unfortunately, these advantages were outweighed by the fact that Japan came into the pandemic with an already-weakened economy as a consequence of last year’s national consumption-tax increase.
Most countries were in V-shaped recovery mode during the third quarter, coming sharply off their low points in May and June. Those that had the harshest COVID-19 experience and the most restrictive lockdowns have generally experienced the strongest recoveries. The question, however, is how long it will take to get back to pre-pandemic levels of economic activity. It probably will take at least another year, perhaps longer, for most countries. The sharp bounces in overall business activity recorded over the summer are expected to fade, although there should still be additional improvement in the months ahead. We are assuming that future lockdowns to contain COVID-19 outbreaks will be far more limited in scope compared to those mandated at the start of its spread. Treatments for the virus have improved in developed countries at least, and vulnerable populations in these regions appear to be better-protected than was the case in the initial months of the pandemic.
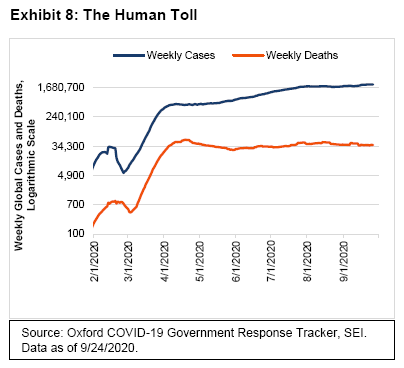
Exhibit 8 shows the weekly totals of new confirmed cases versus confirmed deaths globally. The weekly death toll has remained below the peak briefly reached in April of more than 50,000 worldwide. Still, the figure has since remained tragically ugly, with some 37,000 deaths confirmed globally per week as of the end of September (the U.S. alone continues to report over 5,000 per week). Meanwhile, the number of new cases diagnosed each week has exceeded two million since mid-September. Granted, testing was extremely limited earlier this year and remains far less pervasive in many countries than is necessary. Still, we take some comfort in the fact that the number of lives lost on a weekly basis has not sharply increased as economies re-open and the number of confirmed infections soar.
The world is not out of the woods, to be sure. There has been a surge in new cases in India (making that country the latest epicenter of the disease), severe outbreaks on college campuses in U.S., and a new round of lockdown restrictions and mask-wearing rules in Europe. The U.K. government recently limited social gatherings to six people (down from 30) and advised the public to work from home for the next six months when possible.
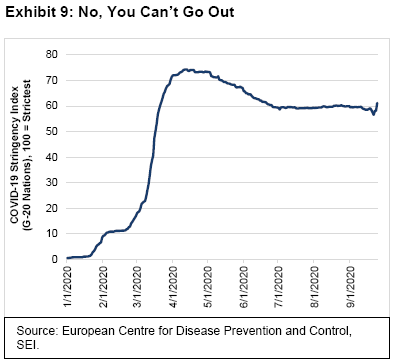
Exhibit 9 features the COVID-19 Government Response Stringency Index (Stringency Index), a new series published by the University of Oxford that measures worldwide government responses to COVID-19 based on seven indicators—such as restrictions on public transportation and air travel, cancellations of public events, closures of schools and workplaces, and other stay-at-home requirements. For the chart in Exhibit 9, we aggregated country data from the Stringency Index to focus solely on governmental responses to COVID-19 over time in the so-called G-20 (or Group of Twenty, which comprises 19 member countries and the EU). China accounted for the initial swing upward in this measure, with other countries following in dramatic fashion during March. Restrictions generally peaked in early-to-mid-April, with lockdowns easing and mobility improving through the end of June. However, there has not been much improvement in this measure on an aggregate basis in recent months. India had the strictest policies of any country in April and continues to have more restrictions than most. Argentina is currently the most restrictive country by this measure, followed by India, Australia, South Africa, Mexico, Ireland and the U.S.
At SEI, we doubt there will be a full return to normal economic behaviour until safe and effective vaccines are introduced and distributed globally. The news on this score has been mostly positive; this, along with the massive fiscal and monetary response, is probably a key reason for the continued buoyancy of equities and other risk assets. According to the World Health Organization, researchers are testing 38 vaccines in clinical trials, and 93 more are in preclinical testing. Ten vaccines are approved for large-scale efficacy and safety trials, five of which (four from China and one from Russia) are already being given to citizens without extensive Phase 3 testing—a risky short-cut in the view of American and European vaccine developers.
Vaccines for COVID-19 are nevertheless on an amazing development track. The vaccine development process has historically taken a decade or longer from initial academic research to mass distribution. In the current crisis, efforts are targeting widespread distribution of a COVID-19 vaccine in only 12 to 18 months from when the virus was genetically isolated in January 2020. This unprecedentedly ambitious goal was deemed possible because scientists were able to leverage the knowledge gained from the coronavirus outbreaks associated with Middle East Respiratory Syndrome in 2012 and Severe Acute Respiratory Syndrome in 2003 instead of waiting for new academic research; speeding up the trial process itself; and, critically, the willingness to construct and outfit factories to begin mass-production of a number of vaccines still in clinical trials on the optimistic assumption that at least some will display the necessary safety and efficacy characteristics needed for final approval. While one or more vaccines are expected to be ready before year end in the United States, distribution to the general public (beyond first-responders and the most vulnerable populations) is projected to take several more months. We think it is realistic to assume that a few different types of vaccines will be generally available by this time next year, which means that social-distancing measures will likely be recommended well into 2021 and, most likely, into 2022.
Where there’s a will, there’s a WEI
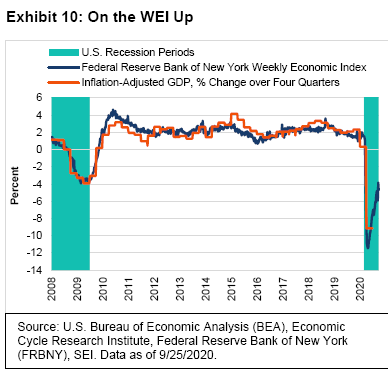
Exhibit 10 focuses on the rebound in U.S. economic activity via the Weekly Economic Index (WEI), which is published by the Federal Reserve Board of New York (New York Fed). The WEI is composed of 10 high-frequency indicators of U.S. economic activity that reflect consumer behaviour, the labour market and production1, and is scaled to align with the four-quarter change in the country’s inflation-adjusted GDP. The low point for the WEI came in late April, but it has improved rapidly over the past five months. The latest reading aligns with a year-over-year GDP decline of 4.6%. Using a 13-week moving average to reflect the quarterly reporting of GDP, the WEI suggests the final reading of third-quarter GDP will still be 6.1% below its year-ago level. To put that number in perspective, U.S. GDP fell 4% peak-to-trough during the 2007-to-2009 global financial crisis.
In Exhibit 11, we compare the New York Fed’s WEI to the Federal Reserve Bank of Dallas’ Mobility and Engagement Index (MEI). The MEI is based on geolocation data collected from a large sample of mobile phone devices throughout the U.S. It measures the pandemic-driven deviation from typical pre-pandemic mobility behaviours in January and February.
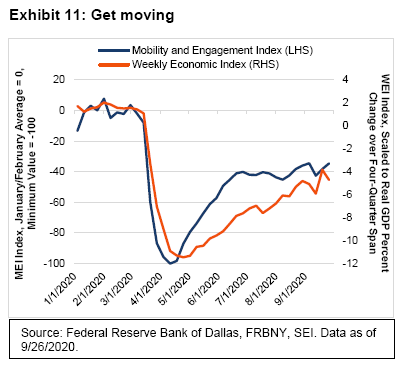
The contraction in U.S. economic activity closely coincided with the downturn in mobility in late March and early April. The MEI bottomed out during the week that ended on April 11, just two weeks before the WEI did the same. While mobility initially recovered more quickly than economic activity, the latter has been catching up. Note, however, that the MEI flattened in June—near the time of surging COVID-19 infection rates in the country’s southern and western states. We will be watching closely to see if virus outbreaks during the autumn months cause the mobility indicator to weaken again.
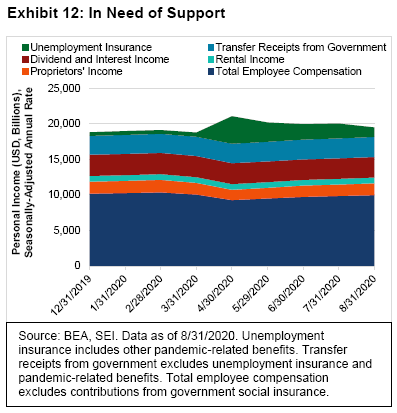
There’s no disputing that U.S. economic activity remains far below normal. Additional support to households, businesses and state/local governments still appears necessary, in our view. Yet divisive politics has stymied attempts to provide additional fiscal relief following the government’s rapid and strong fiscal response in the spring. Exhibit 12 examines the change in individuals’ total earnings, broken down by personal income components, beginning right before the pandemic. The jump in unemployment benefits and other pandemic-related benefits earlier this year stands out. As the economy was faltering in April, pre-tax incomes were pushed up 12.2% due to enhanced unemployment benefits and other income-support programs such as the $1,200 stimulus cheques paid to qualifying individuals (tax deferrals caused after-tax income to rise even more, a total of 14.8% from the previous month). Without these government transfer payments, personal income would have dropped 6.5% in April.
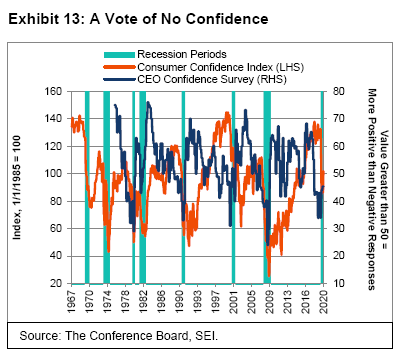
Although incomes are now recovering as more people get back to work, the lack of additional income support may drag down consumer spending as we head into the end of the year. We think it’s concerning that consumer and business sentiment remain depressed (although consumer sentiment did log a surprising gain in September), as highlighted in Exhibit 13. It certainly is a sharp contrast to the buoyancy of the U.S. equity market. Those with an optimistic bent can credibly argue that consumer sentiment is a contrarian indicator: extremely optimistic at the peak of the economic cycle and pessimistic near the bottom. Business sentiment, on the other hand, tends to be more forward-looking. The most recent peak in business confidence came in January 2017. Sentiment then plunged in 2018 as the Fed began to steadily raise interest rates and the Trump administration turned increasingly antagonistic toward China and other major trade partners. Although business sentiment appears to have bottomed, the outlook remains sufficiently uncertain to keep us in a watch-and-wait mode. Now that government support has run out, we would not be surprised to see the official unemployment rate move up in the months ahead as hard-hit industries such as airlines and chain-store retailers eliminate jobs.
A FAIT(h)-based approach to Fed policy
Fed Chairman Jerome (Jay) Powell recently unveiled a new framework for conducting the central bank’s monetary policy. Rather than take pre-emptive actions when the unemployment rate reaches such a low point that inflation might increase, the Fed will now wait until inflation pressures actually worsen before responding. Just as significant, an inflation rate of 2% will no longer be considered a ceiling, as it has been since an official inflation target was first put in place in 2012. Rather, the Fed will pursue a policy of “flexible average inflation targeting,” or FAIT. Its goal is to have inflation average 2% over time. If the average runs below 2% for a given period, the central bank says it will let inflation “run hot” for a while. We don’t really know to what extent or how long inflation would be allowed to stay above 2%. That’s the “flexible” part of the new framework.
In any event, it is clear that the U.S. central bank has decided to see how low the unemployment rate can get before it causes the inflation rate to exceed the 2% mark by a meaningful extent. Of course, now is the perfect time to introduce such a policy change; the unemployment rate is exceptionally high and inflation is unlikely to accelerate on a sustained basis anytime soon owing to the substantial amount of slack currently in the economy.
Exhibit 14 highlights the fed-funds rate, as well as the U.S. headline unemployment rate, and the core inflation rate (measured by the personal-consumption expenditures [PCE] deflator, excluding food and energy). Typically, the Fed is quick to cut its policy rate a few months prior to an increase in the unemployment rate (or just beforehand). The most recent cycle was no different, with the last rate hike in January 2019 being followed by a reversal in July of that year. Additional reductions in the federal funds rate occurred in October 2019 and January 2020. This was a time when unemployment held steady at a low 3.5%-to-3.6% rate. The year-over-year rise in the core PCE deflator also held steady during this period, at around 1.75%.
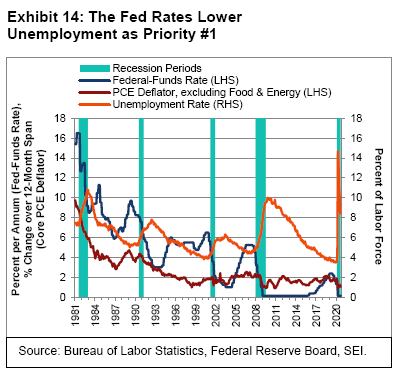
When it became clear that the coronavirus would necessitate a lockdown of the U.S. economy, the central bank was quick to bring the fed-funds rate back to the zero bound for the first time since 2015. According to the Federal Open Market Committee’s (FOMC) official projections, the fed-funds rate is expected to stay near 0% through 2023.
We wonder whether the U.S. central bank’s new framework will make any practical difference over the next few years. Following the global financial crisis, the fed-funds rate remained stuck near zero for the next seven years. Even in previous cycles, the Fed did not begin to raise its policy rate until three years or so after the recession had ended. One thing is clear: The Fed has lost one of its primary policy tools—the fed-fund rate —for a long time to come. If push comes to shove, the central bank could manipulate the yield curve as the Bank of Japan does, pushing intermediate- and longer-term yields even closer to zero. The Japanese experience suggests that such efforts will do little to lift the economy out of a slump or push inflation markedly higher. Indeed, even the FOMC’s own inflation projection does not envision a return to 2% inflation until the end of its forecast window in 2023. If the central bank desires inflation to run above 2% to make up for years of undershooting its target, it will be a long time before the fed-funds rate rises.
In our view, all that’s really left in the central bank’s monetary toolbox is quantitative easing, along with the provision of lifeline support to corporations as well as state and local governments through the various credit facilities that it has created. Since the start of the pandemic crisis, Chairman Powell has used his press conferences to encourage the politicians in Washington, D.C., to aggressively ramp up fiscal spending to support the economy; the Fed stands ready to step in and indirectly absorb that newly-created debt by purchasing securities in the open market. This reduces the upward pressure on interest rates all along the yield curve, and allows all borrowers—not just the federal government—to keep their interest expense low even as they add more debt to their balance sheets.
Exhibit 15 highlights in dramatic fashion how the Fed is absorbing the bulk of the increase in the federal government’s budget deficit. The central bank is currently buying $80 billion of Treasury securities per month, plus an additional $40 billion per month of mortgage-backed securities.
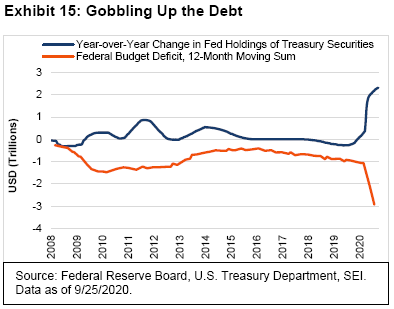
This monetization of debt will likely continue until the pandemic crisis is well past us and the unemployment rate again approaches its previous lows.
When making investment selections, it is best to ignore U.S. elections
As much as we would like to do so, we can’t deny the elephant and the donkey in the room. Yes, the 2020 U.S. presidential election will have a major impact on the economy and financial markets in the months and years ahead. Still, we firmly believe that it would be a mistake to base even a short-term investment strategy on a plan that necessitates accurately predicting: (1) the election winner; (2) the policies proposed by the newly-inaugurated president; (3) the ways in which Congress will modify those proposals throughout the legislative process; or (4) the impact those new laws would have on the economy and financial markets.
Exhibit 16 documents the S&P 500 Index’s one-month and one-year returns following each of the last 13 presidential elections, starting with Richard Nixon’s victory over Hubert Humphrey in 1968. Looking at this chart, the only conclusion that can be made with any confidence is that market volatility tends to rise both immediately following a presidential election and over the following year. What cannot be established with any conviction is the typical direction or magnitude of equity-market shifts in either post-election time frame. That noted, and while there are no guarantees, history suggests that stock prices could weaken in the short term, but will likely bounce back the following year.
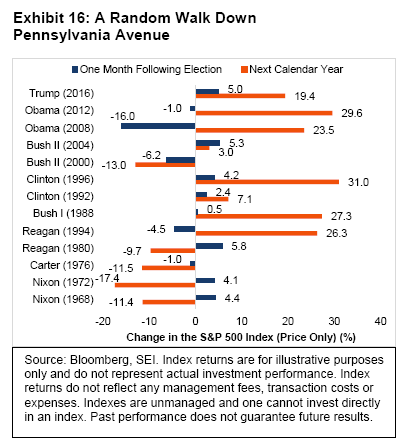
A study published by Ned Davis Research3 noted that the U.S. stock market tends to correct most sharply when a Republican incumbent or party loses the election. On average, the stock market began to correct in the September of those election years as investors anticipate a regime change; that correction continues into the first two months of the succeeding year; the market then bottoms—and advances sharply through the rest of the new Democratic president’s first term in office. This pattern, however, needs to be viewed with a skeptical eye. Since 1900, there have been only six instances when a Republican president or party has lost an election (1912, 1932, 1960, 1976, 1992 and 2008). Two of those periods were marked by severe economic stress (1932 and 2008). There aren’t enough observations to say with confidence that the pattern will hold in 2020 and 2021 should the incumbent face defeat.
We understand that investors might be concerned about the possible implications of a Democratic Party victory, as the economic agenda is clearly one that would include sharp tax hikes on corporations and high-income individuals. Even if the Democrats take control of the Senate, we expect it will be difficult to push through some of the more controversial measures, such as an increase in the capital-gains tax to the same level as the tax rate on wage income, a newly proposed wealth tax, and an imposition of additional payroll taxes on the highest wage-earners. In any event, the damage already done to government finances at the federal, state and local levels probably means that taxes will be going up no matter who controls the White House and the Congress come January.
Regardless of this election’s outcome, our bias is to assume that both candidates would see their platforms tempered before being put into practice. There is a high degree of institutional inertia, which is partly deliberate (constitutional checks and balances) and partly happenstance (increasing polarization of opinion in the country tends to favour a draw). While there could be some market volatility plausibly attributed to the election, we believe it is usually best to pay strict attention to the fundamentals and ignore the politics.
Revolution is in the air
A battle has been raging since the stock market bottomed in March. Despite the obvious advantages of Big Tech and social media companies (that are the chief beneficiaries of the economic disruption caused by the pandemic), a broader grouping of growth sectors versus traditional cyclical sectors suggests that a rotation may be underway.
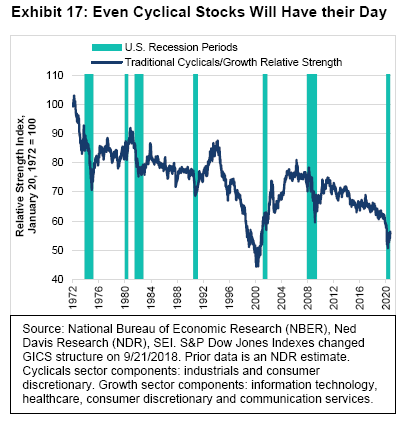
Exhibit 17 highlights the fact that the relative performance of cyclical stocks often improves in the midst of a recessionary period. Sometimes the recovery in cyclical stocks versus growth looks like a “V”—but that turnaround can also be choppy and more prolonged, as it was in 1982 and during the tech bust of 2000.
SEI’s equity managers are generally positioned for a rotation out of the favoured few, into sectors and markets that have lagged sharply in recent months. When that rotation will decisively occur is hard to say; it might coincide with early signs that the COVID-19 infection rate is subsiding as one or more vaccines become available to the general public. Increased investor confidence that the world is getting back on track should greatly reduce the relative appeal of the most expensive stocks in the market place.
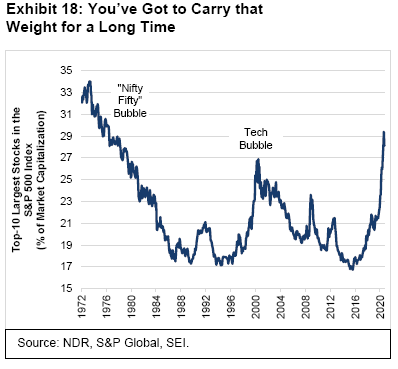
Exhibit 18 shows just how concentrated the market has become. The top-10 stocks in the S&P 500 Index accounted for 29.4% of its market capitalization as of the end of August. Although this weight edged lower in September to 27.4%, it still exceeds the high recorded at the peak of the tech bubble in March 2000. One needs to go all the way back to the “Nifty-Fifty” days of the early 1970s to find a time when so few stocks accounted for so much of the S&P 500 Index’s market capitalization.
We are not suggesting that these stocks are heading for a crash; their immense cash-flow generation and overall profitability argue against it. But valuations are high, especially when viewed against the normalized earnings of cyclical companies. Exhibit 19 narrows the focus to the top-five companies by market cap: Microsoft, Apple, Amazon, Google and Facebook.
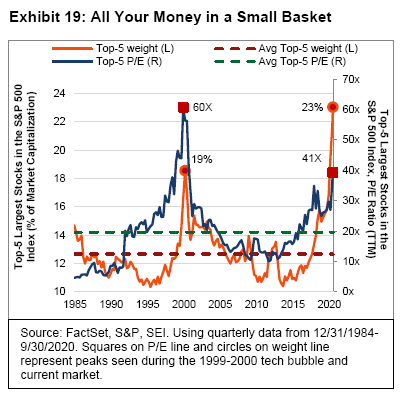
At the end of September, their combined market cap amounted to nearly 25% of the total capitalization of the S&P 500 Index versus 19% in March 2000. This is well above the 13% average combined weight for the five largest (at the time) S&P 500 Index companies over the past 35 years. The price-to-earnings (P/E) ratio for the trailing 12 months currently stands near 41 times for what we’ll call the “favoured five” (much lower than the 60 multiple that marked the height of the tech bubble). That said, the trailing P/E ratio of today’s top five is still twice that seen, on average, since 1985.
One can argue that such valuations are justified given these companies’ strong fundamental performance in both absolute terms and relative to the rest of the market. However, history shows time and again that even the best companies do not stay in that position forever. Some of the possible catalysts that could lead to a major change in investment regime include a deceleration in earnings growth from super-fast to merely fast; an acceleration in growth of the laggards in response to a vaccine and a return-to-work trend; a shift in the political winds that leads to higher taxes and more aggressive anti-trust enforcement; or a rise in bond yields that would harm high-multiple growth stocks more than low-multiple value stocks.
Britannia waives the rules
Political dysfunction is not limited to the U.S. The U.K. is undergoing its own unique melodrama. It was just nine months ago when Prime Minister Boris Johnson was riding high, following his party’s spectacular win over former Labour leader Jeremy Corbyn and his party. Now Prime Minister Johnson is facing a rebellion among his own backbenchers and intense criticism from senior Conservatives (including five former Tory leaders) over his proposal to renege on the withdrawal treaty that would allow Northern Ireland to trade without border restrictions with Ireland and the rest of the EU. The move to abrogate the treaty, if successful, would almost certainly lead to a so-called hard Brexit and a reversion to the World Trade Organization’s most-favoured-nation trading rules with the EU. It also could breathe new life into the separatist movement in Northern Ireland itself, not to mention Scotland. All this comes at a time when the U.K. economy is reeling from the impact of COVID-19 on economic growth.
Prime Minister Johnson’s decision to try to walk away from the Withdrawal Treaty reflects his government’s frustration with EU negotiators. There are two main sticking points, one small (fisheries) and one large (EU strictures on government financial assistance to private-sector businesses). The EU fishing industry wants full access to U.K. waters. This demand is a sensitive issue for the U.K. fishing industry; the industry itself is not large economically, but it has been a key pro-Brexit constituent. The larger issue concerns the EU’s demand that the U.K. continues to adhere to the EU’s rules restricting government subsidies to businesses or aiding domestic industries through an easing of environmental, labour or consumer-protection regulations.
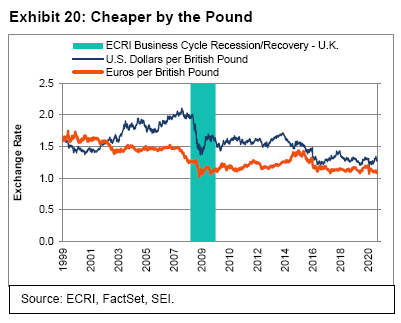
The U.K. is heavily dependent upon trade with the EU, and vice versa. Over 40% of the U.K.’s exports go to the EU, and over 50% of its imports come from the EU. According to the U.K. government’s own analysis, the impact of a hard Brexit would amount to a decline totaling 7.6% of GDP over the next 15 years compared to where the economy would be if Brexit did not happen at all. Surprisingly, the currency remains in the trading range that has been in place since mid-2016, when the Brexit vote was held. However, as we show in Exhibit 20, the pound is threatening to break through to the downside against the euro.
The Bank of England (BOE), meanwhile, is facing a dilemma similar to that of other major central banks: How does a central bank support an economy during a time of severe economic stress when interest rates are already at rock-bottom levels?
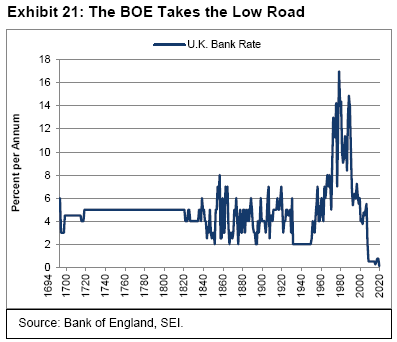
In Exhibit 21, we show the BOE’s policy rate going all the way back to the institution’s founding in 1694. The Official Bank Rate, now at 0.10%, has never been lower. Speculation is growing that the central bank may push its policy rate below the zero bound if the economy continues to falter. In the meantime, the BOE continues to pursue its quantitative program of gilt (U.K. government bond) purchases, which was re-started at the end of March after a multi-year hiatus. Thus far, the central bank’s stock of gilts holdings has increased £240 billion, or nearly 60%, in the past six months.
In Exhibit 22, we show that the MSCI United Kingdom Index (total return) has badly lagged its MSCI Europe ex U.K. counterpart since March in local-currency terms. The U.K. market had been an in-line performer versus the rest of Europe since the Brexit vote in June 2016, although it started to fade on a relative basis during the second half of 2019. When the pandemic hit, both indexes experienced waterfall declines. Although the prospect of a messy divorce from the EU may account for part of the poor relative performance in U.K. equities, we think the problem lies largely with the composition of the country’s stock market.
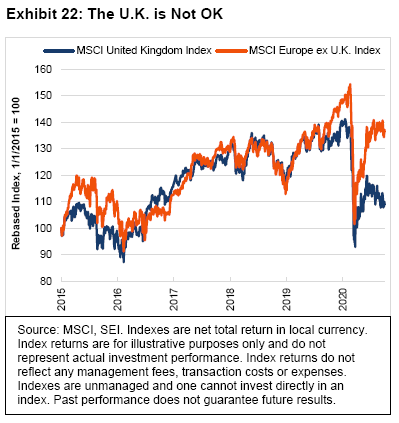
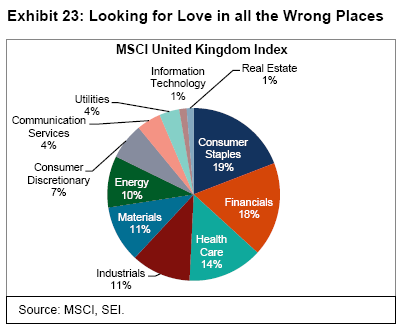
Exhibit 23 breaks down the MSCI United Kingdom Index into its constituent sectors. Notice the near-complete lack of technology exposure, amounting to just 1.38% of the Index. Financials (17.6%), industrials (11.2%), materials (10.7%) and energy (9.7%)—areas that have been hit hard by the global downturn—make up half of the market capitalization of the MSCI United Kingdom Index.
Obviously, a hard Brexit will not help matters. But the worst impact potentially will be sustained by financial companies and other service-producing entities, since World Trade Organization rules deal mostly with tradable goods. The increase in tariffs, for the most part, will be bearable once border-related issues are worked out. In the meantime, the U.K. and the rest of Europe are facing a second wave of the virus that could turn what’s been a V-shaped recovery into something more like a W.
Japan’s changing of the guard implies guarding against change
When Shinzo Abe became Prime Minister in 2012, he had a plan to shake up the lethargic and deflationary Japanese economy with a program referred to as the “Three Arrows.” The first arrow was a policy of aggressive monetary easing, with the aim of ending Japan’s long period of price deflation and eventually achieving a 2% inflation rate. The second arrow involved a massive increase in fiscal spending on public works, a step-up in military spending, aid for business, and other economic stimulus measures designed to jumpstart economic growth and bring real GDP toward a sustainable 2% per-annum rate. The third arrow had a longer-term perspective, providing structural reforms that would improve productivity, deregulate labour and product markets and disrupt the cozy relationships that had long protected big companies from domestic and international competition and shareholder accountability.
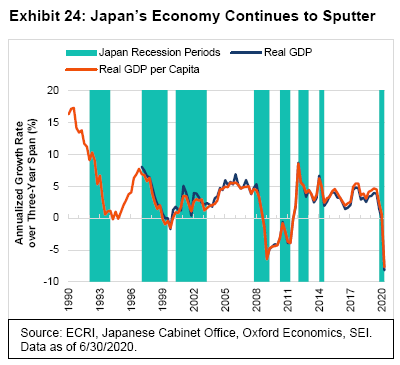
As with any complex, all-encompassing program, there were hits and misses. In Exhibit 24, one can see that economic growth accelerated in 2013, but reverted to pre-Abe form thereafter.
Concern about fiscal deficits and debt sustainability led to increases in the national sales tax in 2014 and again in 2019. On both occasions, household and business spending patterns were severely disrupted, and caused the economy to fall into recession. This year’s pandemic and postponement of the summer Olympics proved to be a bitter ending to Abe’s record-breaking term of office.
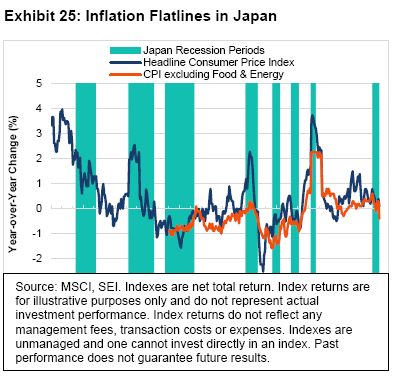
The push to lift Japan out of its deflationary spiral was somewhat successful, as we show in Exhibit 25. Prices mostly stopped declining in the aggregate—but, apart from the impact of the national consumption tax increases, there were few occasions when overall CPI inflation rose above 1%. Core inflation, excluding food and energy, has mostly bobbed around the 0% mark in recent years. Pandemic pressures have caused a return to outright deflation in recent months.
In our view, it is unlikely that radical changes will be made to the direction of policy under the new prime minister. In the near-term, the priority will be on the response to the coronavirus. Fiscal policy will remain quite expansionary, as it is in many other countries. The Bank of Japan will continue to buy most of the government-issued bonds, along with other types of corporate debt and equity, as it has been doing as part of its Quantitative and Qualitative Easing program. This program has been in place over the past four years.
Although the various factions in the ruling Liberal Democratic Party (LDP) agreed to Yoshihide Suga’s ascension to the Prime Minister position, his term is set to expire in October 2021. Suga is already a lame-duck to some extent. One of the ways he could strengthen his hand politically would involve calling a snap general election for this autumn. This could prove risky, however, since he does not control any LDP faction like other leading politicians with aspirations to become the next Prime Minister. Although Suga has been an effective “backroom” negotiator, his standing with the broader Japanese electorate is unclear.
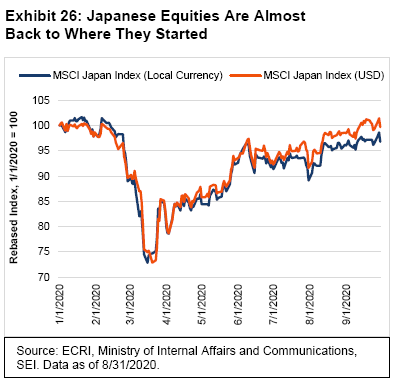
As we show in Exhibit 26, Japanese equities (MSCI Japan Index, total return) have recovered from their pre-pandemic lows. They lag the U.S. by more than 10 percentage points in local-currency terms year to date at the end of September. The strengthening of the yen this year means that Japanese equities are lagging their U.S. counterparts by 7.6 percentage points in U.S. dollar terms. We have no reason at this point to expect Japan’s stock market to jump as it did following Shinzo Abe’s election in the autumn of 2012.
Diverging emerging markets
As we noted at the beginning of the report, the best economic performance during the second quarter was recorded by the major Asian economies (China, Taiwan and South Korea). The same goes for their stock markets. As Exhibit 27 shows, the total-return price indexes of these three countries are now positive in the year to date. Their heavy tilt toward technology and advanced industrial sectors is an obvious plus in the current environment. Multinationals are also shifting some operations out of China to Taiwan and South Korea as part of supply-chain diversification efforts. The MSCI China and MSCI Taiwan Indexes (total return) are both up by more than 15% year to date at the end of September. South Korean stocks are up almost 5%, about in line with the performance of the MSCI USA Index (total return) for the same period.
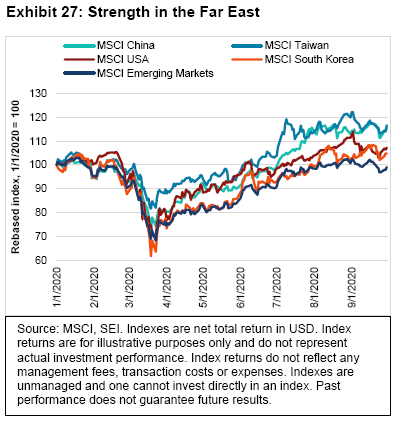
The contrast of the big Asian stock markets versus other large emerging-market stock markets is dramatic. Brazil is still down nearly 40% from its year-end 2019 level. Russian and South African stocks are down 28% and 21%, respectively. India has managed a decent recovery off its low, but is still down almost 5% year to date at the end of September.
China’s strong gains can be chalked up to the rebound in economic activity. Although travel and other services are still constrained owing to lingering concerns about the virus, infrastructure-related spending and manufacturing have experienced an almost-complete recovery to pre-pandemic levels. Investors seem to be unfazed by the deterioration in the U.S.-China economic relationship or by the increasingly fraught diplomatic relations between China and other countries, whether it be the U.S., India, Australia, Canada or its nearest neighbours with whom it engages in frequent disputes over territorial waters.
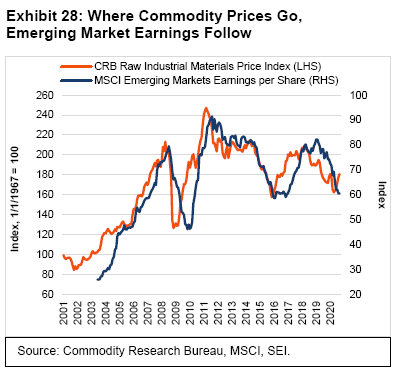
Similar to advanced-country stock markets, we think the odds will favour a rotation out of the few winners into more cyclical areas of the emerging world as global economic growth returns to a more normal pattern. Emerging markets are already showing some good news. Exhibit 28 illustrates the close correlation between commodity prices and the earnings per share of the MSCI Emerging Markets Index constituent companies. The price of raw industrials bottomed in early May, and these commodities have enjoyed a sharp move higher. If industrial commodity prices behave as they have in previous cycles, advancing in a sustained, multi-year fashion, it’s a good bet that emerging-market corporate profits will also rise sharply. During the last major upcycle (from January 2016 to January 2018) in commodity pricing and earnings, the MSCI Emerging Markets Index (total return) nearly doubled.
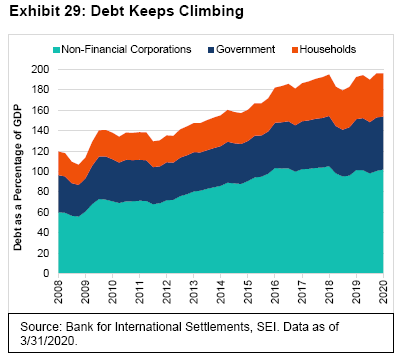
Our optimism is somewhat tempered by the rising debt burden facing many emerging countries. Exhibit 29 tracks the rising trend of debt as a percentage of GDP since 2008. Emerging-market governments, households and non-financial corporations have increased their debt in the aggregate from 120% of GDP to nearly 200% as of 2020’s first quarter. This percentage is set to rise dramatically when second-quarter debt figures become available, as debt issuance by governments and corporations spike higher in response to the pandemic amid the GDP collapse. By year-end 2020, the overall debt-to-GDP ratio could be north of 215%.
Much of that increase in emerging-market debt has been tied to the corporate sector—especially in China, where private domestic, nonfinancial debt has reached an eye-watering 216% of GDP. That’s almost double the share of GDP recorded at the end of 2008, according to the Bank for International Settlements. Thus far, China has proven the skeptics wrong about its ability to handle the debt load. Of more concern are the mostly small-to-medium-sized countries that are running current-account deficits and are too dependent on external hard-currency debt, or do not have the reserves to easily cover their debt service. Argentina, Ecuador, Zambia and Angola have already reached restructuring agreements with creditors. Venezuela’s debt is trading at such depressed levels that some managers believe there is value to be found there. More than 100 countries, including South Africa and Egypt, are seeking help from the International Monetary Fund. Turkey has refused to seek such assistance, but surely could use it; its currency has depreciated sharply this year. On September 25, Turkey’s central bank raised its policy rate by two full percentage points to halt the slide.
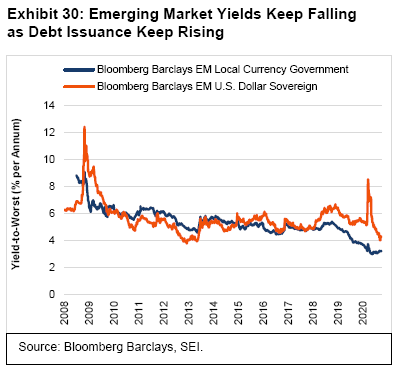
The actions of the world’s major central banks back in March, especially the Fed’s provision of U.S. dollar liquidity, have helped to ease the strain on the market for emerging-country debt. Governments and other official lenders, meanwhile, have granted loan forbearance to nearly 80 countries. It’s a tougher job to get private creditors to agree to do the same. Nonetheless, as we show in Exhibit 30, yields on dollar-denominated debt issued by emerging-market governments’ have fallen back toward their previous record lows. The decline more than reversed the spike endured in March, prior to the Fed’s rescue operations.
What actions are investment managers taking?
Our large-cap portfolios are performing as expected (in line with their respective alpha sources). While a narrow group of technology stocks make up a historically large percentage of the S&P 500 Index, our U.S. large-cap portfolios are overweight companies with value characteristics (such as those in healthcare and consumer staples). The managers in our portfolios have remained wary of oil-related stocks.
While sticking with value can be difficult, we believe that valuations matter—the U.S. large-cap market appears expensive. Even without expectations of significant price appreciation, we believe that higher dividend yields in the U.S. large-cap space relative to Treasurys are a reason to remain invested.
U.S. small caps lagged large caps in the third quarter, as measured by the Russell 2000 and 1000 Indexes, respectively. However, valuations in the small-cap space appear cheap relative to large caps, supporting the appeal of an allocation to an asset class that already offers strategic diversification to an equity portfolio. Portfolio positioning did not change much during the quarter. We have maintained overweight positions to stocks that are aligned with the value and stability alpha sources. The poor performance of stability and low-volatility oriented stocks during the quarter continued to hamper managers, as high-volatility stocks outperformed.
International markets appear to be searching for some direction as Brexit risks have resurfaced and added to existing pandemic concerns. European economic sentiment rose during the quarter, while consumer confidence generally lagged. Our international equity portfolios have not been making major moves in any specific direction. We continue to favour value. Positioning changes have been minor—value managers added selectively to energy and airline holdings during the third quarter, while momentum and stability managers remained focused mostly on information technology and non-bank financials. Stability managers have been trimming winners within online retail.
In emerging-market equities, there have been minor rotations over the last few weeks of the third quarter, particularly among the high-flying technology companies. There was not really a rotation to the value side, rather just a shift to some of the cheaper names in the technology sector. Some of our momentum managers have been lightening up on China and rotating away from expensive technology names. We believe this is a healthy but moderate sign, and not a significant rotation from growth to value. Worldwide de-globalization looks to be benefiting the local emerging-market regions. The health and balance sheets in emerging-market countries are stronger than they were 10 years ago.
In the fixed-income market, the Fed’s support for financial markets helped spread assets outperform during the period (“spread assets” refers to taxable bonds excluding Treasurys). The Fed continues to support the market, and the central bank extended the maturity on its special credit facilities to December. The recovery in spread assets has matriculated down. Over the last several weeks, we have seen lower-quality bonds start to outperform in securitized sectors. Still, there is a lot of uncertainty in terms of the impact of the virus on travel and leisure companies and their bonds.
In this environment, our core investment-grade bond strategies modestly reduce risk, even as managers added high-quality names with strong balance sheets to their portfolios. We remained overweight spread assets at the end of the third quarter, added to agency mortgages and higher-quality mortgage-backed securities, and maintained an overweight to financials. Overweights to industrials and financials were moderately reduced, while duration and yield-curve positioning were essentially unchanged. A modest overweight to the 30-year part of the yield curve remained; we believe this area will attract demand in a period of risk-off positioning and therefore plan to maintain our position until there is clarity on the path of the virus.
Looking ahead, interest rates are expected to remain low, muting returns on investment-grade bond portfolios. Absolute returns may not be high; however, we believe that fixed income plays an important part in portfolio diversification—essentially serving as an insurance policy against declines in the equity market that actually pays you (albeit, not much) to avoid equity-market volatility.
Our high-yield managers did not make many changes during the quarter. The underweight to energy has been a theme for a while, and our managers believe low energy prices will continue to pressure companies for some time. New issuance is on pace for its largest year since 2014. Speculative-grade defaults are at about 9% and are forecast to peak around 11% before declining again through 2021.
Index Definitions
American Association Staffing Index: The Index tracks weekly changes in temporary and contract employment and serves as an indicator of current economic conditions.
Consumer Confidence Index: The Index is an economic indicator published by The Conference Board to measure consumer confidence, which is defined as the degree of optimism on the state of the U.S. economy that consumers are expressing through their activities of savings and spending.
Consumer Price Index: The Index measures changes in the price level of a weighted average market basket of consumer goods and services purchased by households. A consume price index is a statistical estimate constructed using the prices of a sample of representative items whose prices are collected periodically.
Commodity Research Bureau Raw Industrial Materials Price Index: The Index is a measure of price movements of 22 sensitive basic commodities whose markets are presumed to be among the first to be influenced by changes in economic conditions. It serves as one early indication of impending changes in business activity.
COVID-19 Stringency Index: This is a composite measure based on nine response indicators including school closures, workplace closures, and travel bans, rescaled to a value from 0 to 100 (100 = strictest). If policies vary at the subnational level, the index is shown as the response level of the strictest sub-region.
Dow Jones Industrial Average: The Index measures the stock performance of 30 large companies listed on stock exchanges in the United States.
Federal Reserve Bank of New York Weekly Economic Index: The index measures ten indicators of real economic activity, scaled to align with the four-quarter GDP growth rate. It represents the common component of series covering consumer behaviour, the labour market, and production.
Mobility and Engagement Index (MEI): It measures the deviation from the pre-pandemic mobility behaviour of device users recorded during the January/February 2020 period.
MSCI China Index: a free float-adjusted market-capitalization-weighted index designed to measure the performance of large- and mid-capitalization stocks listed on the Shanghai and Shenzhen exchanges in China.
MSCI Emerging Markets Index: a free float-adjusted market-capitalization-weighted index designed to measure the performance of global emerging-market equities.
MSCI South Korea Index: a free float-adjusted market-capitalization-weighted index designed to measure the performance of large- and mid-capitalization stocks in South Korea.
MSCI Taiwan Index: a free float-adjusted market-capitalization-weighted index designed to measure the performance of large- and mid-capitalization stocks in Taiwan.
MSCI Europe ex UK Index: a free float-adjusted market-capitalization-weighted index designed to measure the performance of large- and mid-capitalization stocks across developed-market countries in Europe, excluding the U.K.
MSCI Japan Index: a free float-adjusted market-capitalization-weighted index designed to measure the performance of large- and mid-capitalization stocks in Japan.
MSCI United Kingdom Index: a free float-adjusted market-capitalization-weighted index designed to measure the performance of large- and mid-capitalization stocks in the U.K.
MSCI USA Index: designed to measure the performance of the large- and mid-cap segments of the U.S. market. The Index covers approximately 85% of the free float-adjusted market capitalization in the U.S.
Rasmussen Consumer Index: The Index is a daily indicator of U.S. consumer confidence and is used as a leading indicator.
S&P 500 Index: an unmanaged, market-weighted index that consists of 500 of the largest publicly-traded U.S. companies and is considered representative of the broad U.S. stock market.
Weekly Economic Index (WEI): The index is composed of 10 high-frequency indicators of economic activity that reflect consumer behaviour, the labour market and production.
Important Information
SEI Investments Canada Company, a wholly owned subsidiary of SEI Investments Company, is the Manager of the SEI Funds in Canada.
The information contained herein is for general and educational information purposes only and is not intended to constitute legal, tax, accounting, securities, research or investment advice regarding the Funds or any security in particular, nor an opinion regarding the appropriateness of any investment. This commentary has been provided by SEI Investments Management Corporation (“SIMC”), a U.S. affiliate of SEI Investments Canada Company. SIMC is not registered in any capacity with any Canadian regulator, nor is the author, and the information contained herein is for general information purposes only and is not intended to constitute legal, tax, accounting, securities, or investment advice, nor an opinion regarding the appropriateness of any investment. You should not act or rely on the information contained herein without obtaining specific legal, tax, accounting and investment advice from qualified professionals. This information should not be construed as a recommendation to purchase or sell a security, derivative or futures contract. You should not act or rely on the information contained herein without obtaining specific legal, tax, accounting and investment advice from an investment professional. This material represents an assessment of the market environment at a specific point in time and is not intended to be a forecast of future events, or a guarantee of future results. There is no assurance as of the date of this material that the securities mentioned remain in or out of the SEI Funds.
This material may contain "forward-looking information" ("FLI") as such term is defined under applicable Canadian securities laws. FLI is disclosure regarding possible events, conditions or results of operations that is based on assumptions about future economic conditions and courses of action. FLI is subject to a variety of risks, uncertainties and other factors that could cause actual results to differ materially from expectations as expressed or implied in this material. FLI reflects current expectations with respect to current events and is not a guarantee of future performance. Any FLI that may be included or incorporated by reference in this material is presented solely for the purpose of conveying current anticipated expectations and may not be appropriate for any other purposes.
There are risks involved with investing, including loss of principal. Diversification may not protect against market risk. There may be other holdings which are not discussed that may have additional specific risks. In addition to the normal risks associated with investing, international investments may involve risk of capital loss from unfavourable fluctuation in currency values, from differences in generally accepted accounting principles or from economic or political instability in other nations. Emerging markets involve heightened risks related to the same factors, in addition to those associated with their relatively small size and lesser liquidity. Bonds and bond funds will decrease in value as interest rates rise.
Information contained herein that is based on external sources is believed to be reliable, but is not guaranteed by SEI Investments Canada Company, and the information may be incomplete or may change without notice.
Commissions, trailing commissions, management fees and expenses all may be associated with mutual fund investments. Please read the prospectus before investing. Mutual funds are not guaranteed, their values change frequently and past performance may not be repeated.


