Economic Outlook: Springtime Delayed (Long Version)
- Dealing with COVID fatigue for another few weeks just as it is getting nicer outside is bad enough. Seeing the lack of progress on the vaccination front in Canada is even harder.
- Canada’s economic recovery has trailed the U.S. recovery but mainly because the U.S. data has been so strong.
- In all, the Canadian stock market should continue to benefit from the global economic recovery and the particularly sharp gains likely to be recorded in U.S. business activity.
While the neighbours to the South are going back to school in person, eating out in restaurants and, in some states, are not even required to wear masks in public places anymore, Canada is going in the opposite direction. Granted, caution has been amply rewarded—the country has experienced far fewer confirmed cases (26 thousand per million population versus 92 thousand) and deaths (606 per million versus 1,660) than the U.S. over the course of the pandemic1. Still, cases are rising again in Canada and Provincial governments are warning that reopening measures will need to be delayed.
Dealing with COVID fatigue for another few weeks just as it is getting nicer outside is bad enough. Seeing the lack of progress on the vaccination front is even harder. Exhibit 1 shows that only 12.3% of all Canadians have received at least one shot of vaccine as of March 29. This share is not much better than most European countries, and lags well behind the United Kingdom and the United States–as well as several other countries that are far less developed economically. The share of the Canadian population fully vaccinated against COVID amounts to a mere 1.8%, slightly behind Brazil. Meanwhile, the U.S. is speeding along and is approaching 16%2.
This poor performance on the vaccination front is surprising, given the fact that Canada had contracted for enough vaccine to give one jab to each Canadian nine times over, the most of any nation. And, in just the past week, the Canadian health authorities have slowed the inoculation process by recommending that people under the age of 55 avoid getting the AstraZeneca vaccine owing to concerns about possible blood clots. Europe’s drug regulator, the European Medicines Agency, looked at this issue and determined the vaccine was safe and effective and did not increase the risk of blood clots (although Germany and some other countries also have decided to limit usage to older people).
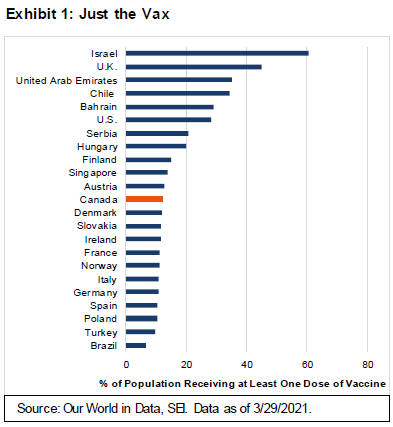
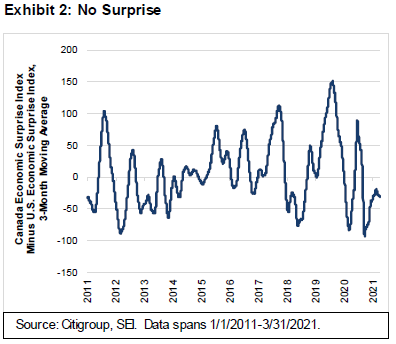
Exhibit 2 on the next page shows that Canada’s economic recovery trails both the U.S. recovery and economist’s expectations. The chart compares Citigroup’s Economic Surprise Index (ESI) for the two countries. A three-month moving average is used to smooth out the weekly gyrations and then the U.S. ESI is subtracted from the Canadian metric. When the line is in positive territory, Canadian data surprises to the upside (relative to economists’ expectations) are more positive than that for the U.S. By this measure, the rebound in Canadian economic activity relative to expectations lagged badly in August, but mainly because the U.S. data were so incredibly strong. As expectations adjusted, the differential subsequently narrowed, but there has been some additional deterioration in Canada’s relative performance in the past month.
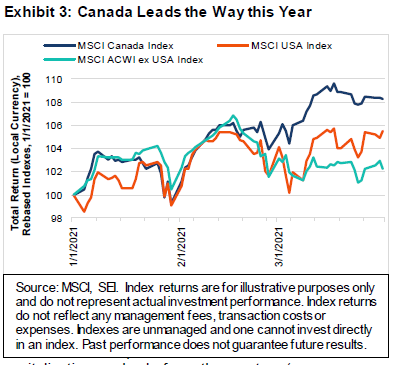
Equity investors, in the meantime, are ignoring the prospect of further delays in the economy’s return to normalcy. As we show in Exhibit 3, Canadian equities literally beat the world in the first quarter, surging 8.3% total-return through March 31, as measured by the MSCI Canada Index. The MSCI ACWI ex USA Index managed a 2.2% gain, while the MSCI USA Index rose 5.5%.
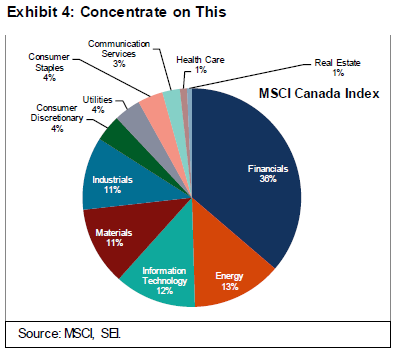
information technology, materials and industrials) make up another 47%. One company—Shopify—accounted for 8.4% of the MSCI Canada index weight at the end of February, and comprised almost 70% of the information technology sector weight.
Exhibit 4 illustrates why the Canadian stock market did so well–its composition was in the sweetest spot to benefit from the worldwide forces driving prices during the first quarter. The Canadian stock market is definitely geared to the favourable monetary and fiscal backdrop that has become a feature of all the major economies. It also remains directly exposed to developments in the commodity markets.
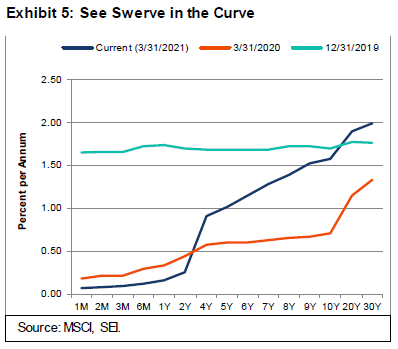
The widening of the yield curve this year, illustrated on the following page in Exhibit 5, has certainly been a helpful factor for Canada’s banks and other financial services companies. SEI’s managers are neutrally positioned toward the sector, however. Valuation is one consideration.
Although the overall Canadian stock market appears reasonably priced versus global markets, its financial sector trades at a 25% premium versus its MSCI World counterparts, measured on a price-to-book value basis; excluding the U.S., the financial-sector valuation premium reaches 50%. Portfolio managers have been sceptical about the high valuations sported by Canada’s banks. This scepticism is reflected in the price performance of the sector, which has lagged the global-sector benchmark over the past 12 months.
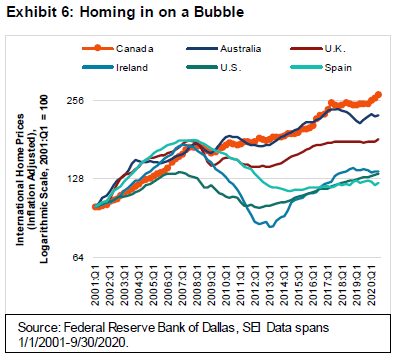
One longstanding concern of economists about the Canadian economy and its banks is the high degree of household indebtedness and exposure to the housing market. Exhibit 6 compares the progression of Canadian home prices in inflation-adjusted terms to a selection of other countries that have experienced relatively strong price gains in the past 20 years. While Canadians participated fully in the international housing bubble of the mid-2000s, they did not experience much of a bust. Real home prices began rising again in 2009, and actually picked up pace in 2017. Another surge is currently underway, but with other countries joining in on the fun.
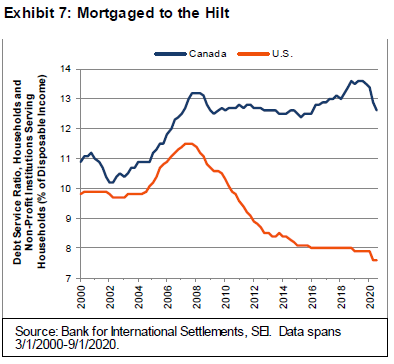
Households in Canada have been willing to bear high debt-service costs to keep the good times rolling in the housing market, as we illustrate in Exhibit 7. Unlike U.S. households, Canadians never pulled in their horns during the global financial crisis. The household debt service ratio reached a new all-time high just prior to the onset of the pandemic. Although the ratio has fallen back to a level last seen in 2015, the factors behind that decline are policy-driven in the form of last spring’s plunge in short-term interest rates and COVID-related mortgage deferrals. The behavioural contrast with U.S. households since 2009 is stark.
In all, the Canadian stock market should continue to benefit from the global economic recovery and the particularly sharp gains likely to be recorded in U.S. business activity. But outperformance versus the U.S. and other countries on a relative basis appears to be very dependent on a strong pricing environment for oil, metals and other commodities, and a continued levitation of home prices. A ramp-up in vaccinations and a return to normal business conditions domestically would also be a big help.
A Healthier World, but a Sicker Bond Market
The war against COVID-19 is not over, but the path to victory has become clearer as more vaccines are being produced and distributed. Accordingly, investors appear to anticipate a return to a more normal world. This is reflected in the rapid rise in bond yields—which has been the most important change in the financial environment so far this year. This jump in yields has caused outsized price drops in long-term fixed-income securities (bond yields and prices move inversely) which has helped fuel a sharp equity-market rotation away from expensive growth stocks and into value-oriented and cyclical sectors around the world.
This widespread rise in yields should not come as a complete shock. At the start of 2021, most economists and bond investors expected rising bond yields. Few, however, predicted the speed or extent of the increases.
While U.S. sovereign debt set the pace, yields have been rising in other countries too, as Exhibit 8 illustrates.
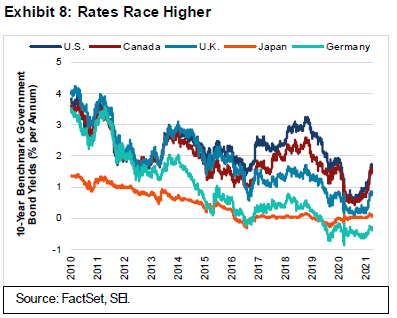
Since the start of the year, the 10-year U.S. Treasury bond climbed from 0.92% to 1.74%, translating into a total-return decline of 7.0% as of March 31, 2021. Measured from just over a year ago, when the 10-year U.S. Treasury yield hit a record low of 0.5% on March 9, 2020, the total-return decline amounts to 9.8%. Longer-term issues suffered greater damage, with the 30-year U.S. Treasury bond down by a whopping 27.8% in total-return terms through March 31, 2021.
A longer-term perspective
Taking a historical total-return perspective, the structural bull market (which begins off of a bear market low and continues until a valuation peak is reached) in 10- and 30-year benchmark U.S. Treasury bonds has been in place for nearly four decades. Exhibit 9 highlights their respective performance from 2000 to the present.
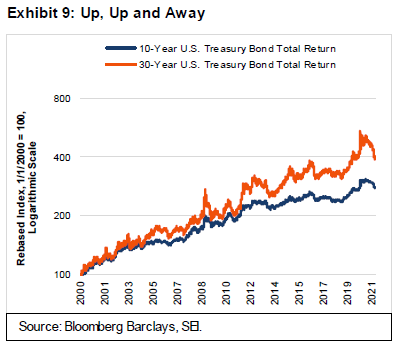
Over this 20-year-plus timeframe, the 10-year bond provided a cumulative return of nearly 200%; the 30-year bond had a total-return gain of 300%. Along the way, however, there have been some major corrections—and the pullback over the past year ranks as one of the sharpest. Of course, the most recent cyclical bull market, which lasted from November 2018 until its peak on March 9, 2020, was unusually strong versus those of previous cycles.
SEI’s fixed-income portfolio managers expect the bond market to stabilize now that higher yield levels have been achieved. This should alleviate some of the selling pressure that technology and other high-priced growth stocks have endured in recent months. Our portfolio managers believe that a new trading range between 1.25% and 1.75% on the 10-year U.S. Treasury bond has been established, although expectations appear to favour the possibility of yields surpassing that and moving toward 2% as the economy gathers additional strength later in the year.
Fixed-income markets certainly face continuing challenges. Even after the boost in nominal U.S. Treasury yields, they remain near the bottom end of the range that has prevailed during the past 10 years, as seen in Exhibit 10. We took this chart all the way back to 1960; because measures of market-derived inflation expectations before 2003 are not available, we derived the inflation-adjusted bond rate by subtracting the year-to-year change in consumer prices (as measured by the U.S. Department of Labour’s consumer-price index, or CPI) from the nominal bond yield. Real rates (that is, the nominal bond yield minus the inflation rate) remain in negative territory.
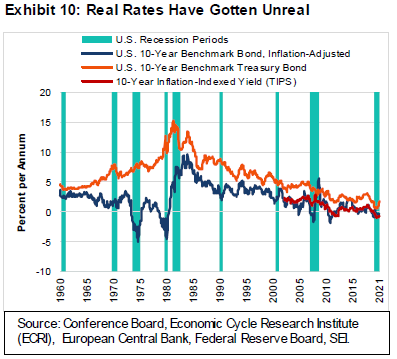
Although more volatile, this rough-and-ready approximation of the inflation-adjusted return still makes the point that negative yields are a rare development—occurring mainly during the highly inflationary period of the late 1970s, a time when the CPI often surprised to the upside. Even if inflation expectations stabilize around the current 2.3%, as implied by the U.S. Treasury inflation-protected securities (TIPS) market, it’s still possible for nominal rates to move higher as real rates climb in response to the accelerated economic growth and surge in government borrowing that are likely to occur over the next year or so.
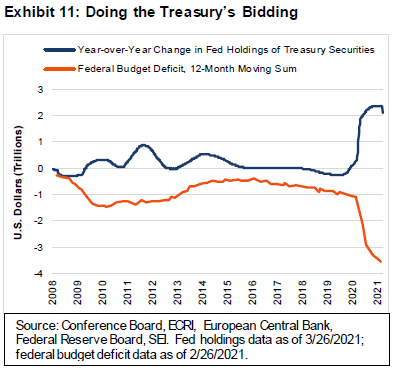
With the third and latest COVID-19 relief package totalling $1.9 trillion, the cumulative amount of fiscal support approved over the past 12 months amounts to a remarkable $6 trillion—a sum that approaches 30% of gross domestic product (GDP). To protect the bond market from the rising tide of U.S. Treasury issuance, the Federal Reserve (Fed) has gone to great lengths in purchasing outstanding issues in recent years. Exhibit 11 shows that the Fed bought $2.1 trillion of Treasury securities in the 12 months ended March 26, 2021; just one month prior, the federal deficit over a 12-month period amounted to $3.55 trillion.
Not all of the money in the $1.9 trillion package will be released at once. The Congressional Budget Office estimates that $1.2 trillion of direct-spending outlays and tax breaks will take place during the fiscal year ended September 30, and that an additional $500 billion of the stimulus money will be released over the course of fiscal year 2022. Rather than being spent on goods and services, some of that money also will be saved.
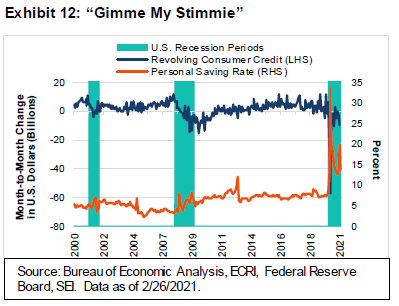
Exhibit 12 highlights how the first two COVID-19 stimulus packages pushed up the personal-saving rate to extraordinarily high levels over the past year. As of February, saving as a percentage of after-tax income was still a high 13.6%. The saving rate for March will almost certainly be reported as another jump, reflecting the latest distribution of rebate checks. As households hunkered down last year amid the government-mandated lockdowns, they dramatically reduced their credit-card debt balances and added a precautionary cushion to their saving accounts.
Inflation rising, too?
That said, there’s no denying that U.S. households now possess a tremendous amount of firepower that can be spent on goods and services as the economy reopens more fully. Economists have been pushing up their estimates of real GDP growth. In the Federal Open Market Committee’s (FOMC) latest set of economic projections released on March 16, it forecast a 6.5% gain in real GDP this year (revised sharply upward from a projection of 4.2% made in December) followed by a solid 3.3% advance in 2022. We think the odds favour a further upward revision. The FOMC also provided a higher projection for the core inflation rate this year, to 2.2% versus its previous estimate of 1.8%. Fed Chairman Jerome Powell has gone out of his way to downplay this shift in expectations, insisting that actual outcomes—not forecasted outcomes—will drive monetary policy.
Chairman Powell and the other dovish members of the Fed point to various measures of labour slack, including the U-6 unemployment rate (which takes into account people who have stopped looking for a job and are no longer counted in the headline jobless rate) and the prime-age labour force participation rate. These statistics are found on the following page in Exhibit 13.
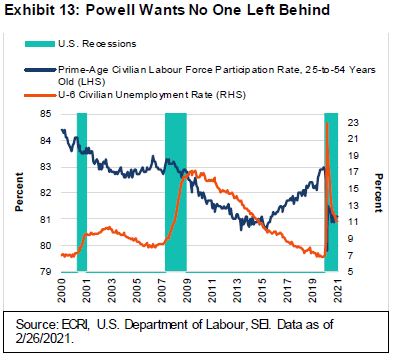
The Fed’s prioritizing of full employment over its inflation mandate also dovetails with the change implemented last year in policy framework to average-inflation targeting. Powell not only dismisses the danger that inflation could become a problem in the future (he’s confident that the Fed has the tools to prevent that from happening) but actually welcomes the prospect of an inflation rate that runs above the central bank’s 2% target for an unspecified period (perhaps a year or more). We believe he will get his wish in the near term, when year-over-year comparisons take into account the lockdown-influenced price declines of last spring.
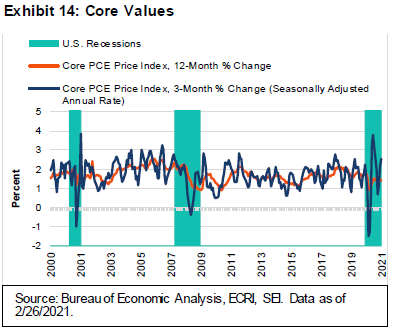
Exhibit 14 focuses on the 12-month and 3-month (annualized) changes in U.S. personal-consumption expenditures (PCE) price index, the Fed’s preferred measure of inflation. We excluded the volatile food and energy components in order to better assess underlying price trends. When measured on a year-over-year basis, inflation still looked dormant through February. However, the year-over-year readings over the next few months should begin to look considerably stronger, perhaps reaching 2.6% with the data for April and May. Headline PCE inflation (which includes food and energy) should be even higher given the dramatic rebound in energy prices off their 2020 lows.
The 12-month change in the PCE core inflation rate should ease as the weakest year-ago results fall out of the calculations. In the three months ended January, core inflation (which excludes food and energy) ran at an annualized 2.2%. Although more volatile than the year-over-year change, a persistent trend above 2% in the three-month pace will be an important signal for investors that inflation pressures are alive and well. SEI’s fixed-income managers are taking steps to mitigate the effect of an accelerating inflation rate and additional upward pressure on bond yields.
Generally speaking, markets appear to have priced in the Fed’s basic inflation scenario of a higher cyclical inflation rate above the official 2% target over the next five years, but a lower inflation rate at or below target in the longer run. Investors expect demographics, technological disruption and globalization—the forces that have kept inflation low in recent decades—to continue to dominate.
Higher bond yields may cause bouts of indigestion in the stock market, but we do not think they will derail the bull market. Rather, we expect to see cyclical and value-oriented stocks continue to advance relative to growth and defensively oriented sectors of the market.
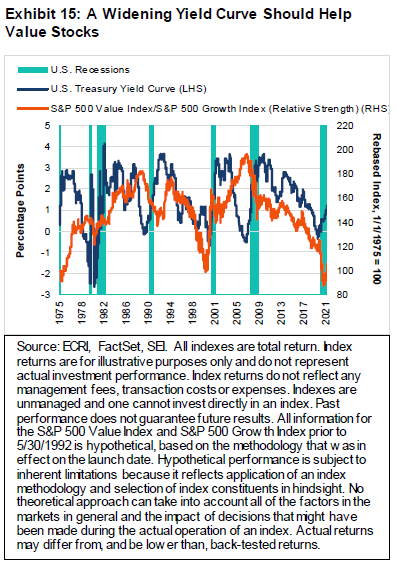
Exhibit 15 on the next page tracks the relative performance of the S&P 500 value stocks versus their growth counterparts and compares that relative performance versus the change in the difference between long-term and short-term U.S. Treasury securities (referred to as the yield curve spread). In most cycles, value stocks outperform growth stocks when the yield curve is rising or is exceptionally wide (rates on long-term Treasury bonds are well above those of their short-term counterparts). The relationship broke down in the run-up to the financial crisis; the return to an exceptionally wide spread in the aftermath of that crisis didn’t help value stocks either. During the spring and early summer of 2020, the shift to technology and work-at-home stocks amid the pandemic overwhelmed the normally positive impact of a rising yield curve.
However, value has been rebounding since its performance against growth bottomed on the first of September. Only time will tell whether the period of value and cyclical outperformance versus growth can extend for several years, an experience that would mimic that of the 1980s and early 2000s.
The U.S. becomes a laggard
While value-oriented stocks make a comeback against growth in the U.S., other countries’ equity markets are making a comeback against the U.S. Exhibit 16 compares the total returns of the MSCI USA Index, the MSCI World ex USA Index, and the five largest country indexes within the MSCI World ex USA. From the beginning of 2020 to the end of August, the MSCI USA Index massively outgained the other indexes represented in the chart. However, since last September, concurrent with the turnaround in relative performance of the U.S. value stocks cited above, other developed-country stock markets have enjoyed a sharp improvement in unhedged, local-currency terms.
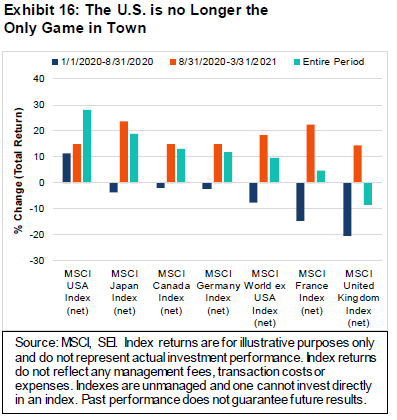
Japan has been the best performer among countries with the highest market capitalizations, gaining 23.54% since the end of August. Its economy has benefited from strong exports to China and the U.S. over the past year. The country’s real GDP at the end of 2020 was only 1.3% below the year-ago level, which was better than most other developed countries (including the U.S.). The Bank of Japan’s decision to maintain its yield-curve-control policy also has been a factor buoying the stock market. The popular Nikkei stock price index has vaulted to levels last seen in the early 1990s. Japan’s longstanding economic problems of debt, deflation and demographic decline have not gone away; they’ve only been pushed into the background by a comparatively mild COVID-19 experience and a decent economic performance over the past year.
France also has seen its stock market gain more than 20% since August. This might be an even greater surprise than the run-up in Japanese share prices. Like much of Europe, the country has been struggling acutely with COVID-19; although, until recently, its government resisted instituting mobility restraints to the same degree as those implemented in other European countries.
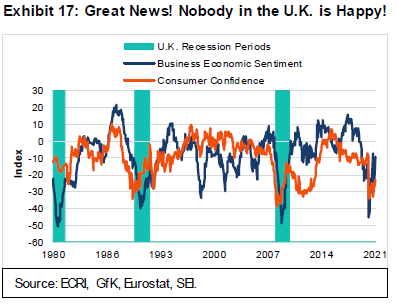
Although the U.K. has significantly lagged the MSCI World Index over the past seven months, its 14.53% total return is only slightly ahead of the U.S. Considering all the uncertainty surrounding Brexit and the lockdowns associated with COVID-19 in recent months, this is not a bad outcome. The gyrations in overall U.K. economic activity through the year may be similar to many other countries, but their magnitude has tended to be greater. More recently, lockdowns caused monthly GDP to decline almost 3% from December to January. The weakness at the start of the year was exacerbated by a steep 41% decline in exports to the European Union (EU). Although COVID-19 lockdowns and Brexit-related shipping delays played a role in the exports drop, another big factor was the unwinding of precautionary inventory stockpiles (both exports and imports surged ahead of the Brexit deadline late last year). Goods exports to non-EU countries actually increased in January, continuing a steady upward progression from their May 2020 trough.
U.K. business sentiment has risen sharply off its lows this year, but consumer sentiment remains rather depressed, as shown in Exhibit 17. With spring’s arrival and the easing of lockdowns on the back of the country’s successful vaccination effort, we look for the U.K. to experience a strong recovery in consumer demand and business activity. That recovery may not match the stimulus-fuelled one that the U.S. is set to enjoy, but should nonetheless be more robust than elsewhere in Europe. Consumer and business sentiment tend to be weakest at the bottom of an economic cycle, so we believe the current gloom should be viewed in a positive light. Sentiment should also improve (in London, at least) now that the U.K. and EU have finally agreed on the way forward to establish rules that will grant additional market access rights for banks and other financial institutions.
U.K. government policy remains supportive in the near-term. But the recently proposed fiscal budget, which adds only about 3% of GDP to the budget deficit for the 2021-to-2022 fiscal year, appears rather restrained compared to the measures taken by U.S. President Joe Biden’s administration. From the 2023-to-2024 fiscal year, policy actions will begin to reduce the U.S. deficit, mostly through an increase in the corporate tax rate from 19% to 25% and through the freezing of income-tax thresholds.
Circling back to the MSCI World ex USA Index, there is one concern worth highlighting. Although not as high as the valuation metrics found in the U.S. stock market, equities outside the U.S. still appear expensive. We highlight this in Exhibit 18, which tracks the MSCI World ex USA Index and compares the actual index price to the different levels that would be achieved at various forward price-to-earnings ratios. The parallel lines in the chart reflect the trajectory of analysts’ forward earnings estimates. Currently, the actual index is priced at almost 17 times the earnings per share forecast for the next 12 months. The forward price-to-earnings ratio has not been this high since 2004.
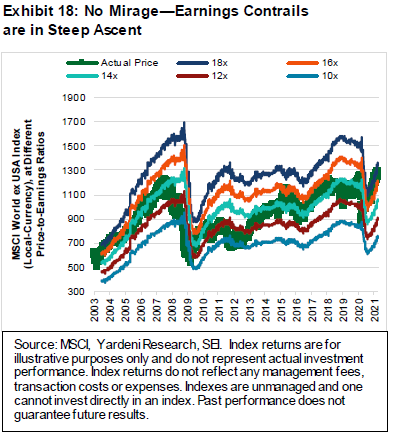
Analysts’ earnings projections probably will need to climb steadily in order for equities to continue their strong run. In the next year or two, this should not be a tall order. As the world’s economies reopen, GDP and corporate profitability will likely continue to rise in a robust fashion. As in the early 2000s, a prolonged and significant improvement in profits growth should lead to higher stock prices. Even if earnings multiples contract, we expect developed-economy equity markets outside of the U.S. to move higher, with above-average gains that could potentially exceed the performance of the MSCI USA Index.
To repeat, developed-country stock markets around the world still look cheap compared to U.S. equities. Because the forward price-to-earnings ratio for the MSCI USA Index is still above 22, it trades at an unusually wide 25% discount. Although longer-term growth differentials justify a structurally higher multiple for U.S.
equities, rebounding economies and rising interest rates should lead to a narrowing of the valuation gap.
Emerging markets: A tempered taper tantrum?
The jump in U.S. bond yields this year has raised investor concerns that emerging countries’ equity and bond markets will be the victims of a 2013-style “taper tantrum.” Back then, the Fed signalled that it would start to taper its purchases of U.S. Treasurys and mortgage-backed securities. Financial markets did not take the news well, with emerging markets hit particularly hard. At SEI, however, we believe that emerging economies are generally in a better position to withstand the pressure of rising rates than they were eight years ago.
Strong growth in the world economy over the next year should help lift most emerging-market stocks. World trade volumes, for example, already reached pre-pandemic levels by the end of last year, as shown in Exhibit 19.
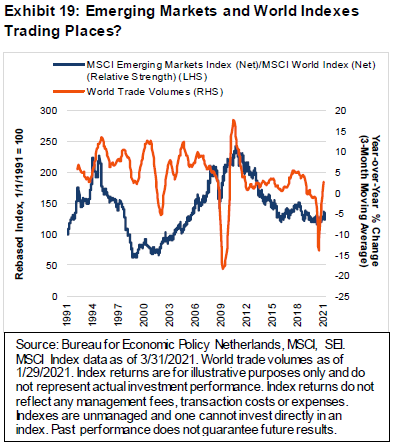
We believe the expansion in trade should continue over the course of 2021, perhaps reaching or exceeding the year-on-year gains of 5% recorded in 2017. When global trade volumes are strong, as they were during China’s spectacular 2001-to-2006 and 2008-to-2010 growth phases, developing-country stock markets tend to perform well against those of economically advanced countries. Note that the relative performance of the MSCI Emerging Markets Index against the MSCI World Index peaked in late 2010, well before the taper tantrum of 2013. Although trade volumes were still solid at that time, the slowing of China’s growth rate was enough to upend the decade-long bull market in emerging-market equities.
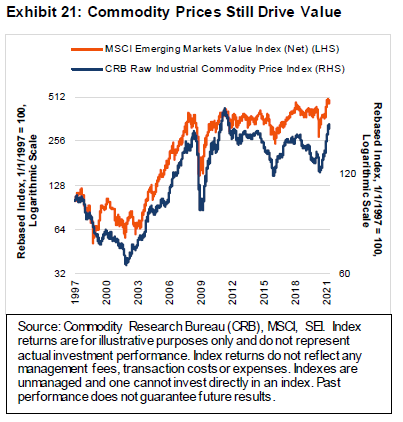
In our view, the economic backdrop strongly supports cyclical-and value-oriented equities in emerging markets, just as it does in developed markets. Exhibit 20 shows that the MSCI Emerging Markets Value Index (total return) is highly correlated with industrial commodity prices. Obviously, commodity prices have already vaulted higher from year-ago lows. Perhaps there will be some consolidation of these gains as investors react to the combination of extended lockdowns in Europe and higher bond yields.
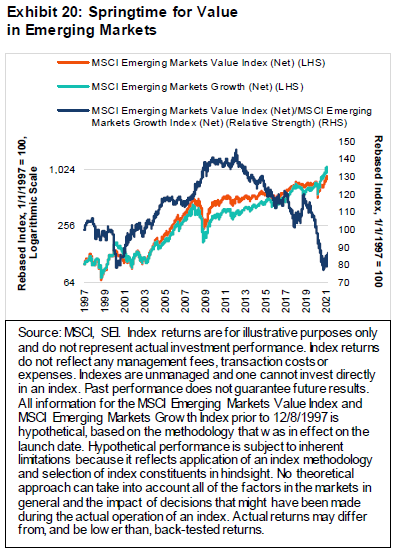
At SEI, however, we believe that more commodity-price gains are on the way. Exhibit 21 on the following page compares the current rebound in raw industrial commodity prices against the last three major bull runs (2002 to 2008, 2008 to 2011 and 2016 to 2018). The current bull market has surpassed the 2016-to-2018 upcycle in magnitude, but amounts to only half the increase recorded during the two earlier bull phases.
Demand for metals and other commodities should get a boost from several sources including strong manufacturing and construction demand in the U.S. and China; the recovery in Europe and Latin America as vaccines become more widely available; the global push for electric vehicles and other climate-projects; and coming U.S. infrastructure package. To put it simply, China will not be the only country driving commodity inflation this time around.
Another reason that emerging economies appear less susceptible to a 2013-style taper tantrum is that their external trade positions are much healthier today. Exhibit 22 illustrates that current-account balances as a percentage of GDP are either in surplus or generally in a much smaller deficit position than they were eight years ago.
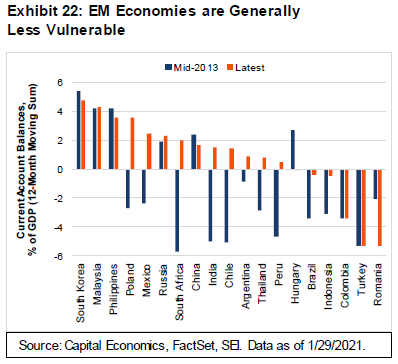
Granted, some big countries face continuing problems. Turkey is one major country that has failed to log an improvement in its external-trade balance. To make matters worse, its economic policy has turned increasingly erratic under President Tayyip Erdogan. He has replaced the head of Turkey’s central bank three times in the past two years. These changes have resulted in a sharp decline in the Turkish lira and caused investor capital to flow out of the country.
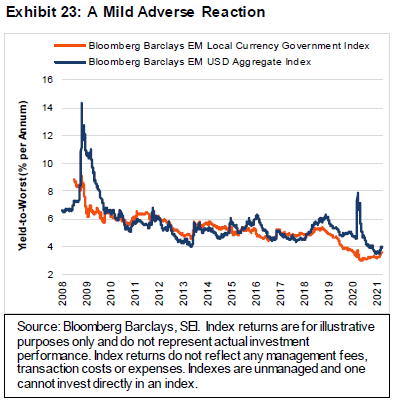
Exhibit 23 indicates that U.S. dollar and emerging-market local-currency bond yields have both moved higher this year. But the rise in bond rates has so far been quite modest, with option-adjusted spreads still near their lows of the past three years. This certainly does not yet qualify as a taper tantrum.
Besides Turkey, debt dynamics among the larger emerging-market countries appear most worrying in Brazil and South Africa. However, most debt in these two countries is denominated in local currency, which allows their governments to engage in some form of financial repression (like quantitative easing) in order to temper the pressure on their bond markets.
Keep your eye on the road ahead and your hands upon the wheel
At SEI, our base case is an optimistic one. As vaccines continue to roll out throughout the world in the months ahead, countries will be able to end their lockdowns and reopen their economies. Business activity should therefore charge ahead, not just in the U.S. and Europe but in other advanced nations too. Developing countries will likely take longer to reopen fully since their vaccination distribution will take time—yet their economies should improve on the upswing in developed-market consumer demand.
SEI’s equity and fixed-income portfolios have benefited from changes in the investment landscape that have already occurred over the past several months; our managers believe they are well positioned for what comes next. Value/cyclical stocks are expected to outperform both momentum and growth stocks. Global equities still have great potential to outpace the tech-heavy U.S. large-cap market. In the global fixed-income market, credit remains favoured over sovereign debt; higher-yielding corporates and emerging markets should maintain their advantage in an investment world that offers few avenues for positive inflation-adjusted returns.
However, having confidence is not the same as being complacent. We continue to track the progression of the virus, the evolution of fiscal and monetary policies, and market fundamentals. In recent weeks, for example, investors have been forced to reassess the speed at which the world economy can return to normal. The near-term rollout of vaccines throughout the EU has been slow (to put it politely), delaying the region’s anticipated rebound.
We expect vaccine-related delays to be resolved in a matter of months—at least in the richer, more economically advanced countries. That noted, although the news out of Israel and the U.K. looks quite good as both are well along the road to vaccinating their respective populations, there is always the possibility that a variant will prove resistant to the vaccines currently on the market. Ironically, the countries that have been most successful in keeping COVID-19 at bay—China, Taiwan, South Korea, Japan, Australia—may be the ones at most risk since they are nowhere near herd-immunity levels. These countries also have been slow in rolling out vaccines, or, in the case of China, face a high degree of vaccine scepticism.
Beyond COVID-19 concerns, we are monitoring investor reaction to government policy moves. We previously noted the huge amount of fiscal stimulus that has been put in place and the equally expansive monetary policy measures employed by the Fed. In the coming months, investors will be increasingly focused on the next big multi-trillion dollar spending package dealing with infrastructure, climate change and a variety of Democratic-favoured social priorities. Tax increases on corporations and high-income households will also be part of this package. As was the case with the recently passed stimulus, the Democrats in the Senate will use the reconciliation process to move the tax and spending program through the chamber on a majority vote. It is doubtful, however, that they will succeed in pushing through all of the proposed measures. Compromises will be necessary to keep their caucus unified. It also is unclear how investors will react as the debate in Washington heats up, especially to the proposed tax increases.
The tax and regulatory changes championed by the Biden administration are not considered business- or stock-market friendly. The same could have been said of the economic policies pursued during former President Barack Obama’s tenure—but nevertheless one the strongest and most enduring bull-market runs in U.S. history persisted. Today, while there’s little doubt that there will be winners and losers both at the industry level and among individual companies, we believe (as always) it is important to refrain from making broad asset-allocation changes based on perceived shifts in the political winds.
As for U.S. monetary policy, we will be watching whether the Fed can maintain its stance of keeping the federal-funds rate near zero through 2023. The federal-funds rate futures market has already priced in the possibility of two or three interest-rate hikes. It all comes down to the path of inflation. If the acceleration in measured inflation proves stronger and longer-lasting than investors expect, bond yields could climb appreciably from today’s levels. How will the U.S. central bank react? Will it lean against that rise in inflation even if the economy is still a distance away from the Fed’s employment goals? Or will the central bank try to suppress the increase in bond yields through quantitative-easing measures or a Japanese-style yield-curve control strategy? If the Fed brings forward policy-rate hikes, we would expect a neutral-to-negative reaction in stocks and other risk assets. Suppressing the rise in bond yields through even more aggressive policy actions, on the other hand, could lead to a weaker U.S. dollar and a sharper investor focus on inflation-hedging strategies and beneficiaries. Stock valuations could get even more expensive than they are now as investors grow even more exuberant. Interesting times, indeed.
What actions are our portfolio managers taking?
In our domestic portfolios, we continue to see a rotation in markets that has benefited our value manager, LSV. Energy and financials performed well in the first quarter, while former market leaders, like gold mining companies and Shopify have underperformed. Hillsdale, a momentum manager, has benefited by rotating into more value names within the energy and financials sectors. Small-cap stock divergences in Canada have been amplified compared to their large-cap counterparts, particularly with gold down significantly and energy rallying sharply. Lower-quality names have also been rebounding.
Within our U.S. large-company portfolios, it was a good quarter for value, but not exceptional when compared to the long-term moves that followed past periods of underperformance. Our portfolios have slightly reduced their value positions, taking profits as prices rose. Positioning remains pro-value, we are just not allowing it to grow due to outperformance. Financials still look attractive, while retail and energy look less so given recent price gains. Even though the stocks of some low-risk, more stable companies (consumer staples, healthcare) have gotten cheap, there’s not much of an opportunity for information technology as the sector remains expensive.
For our U.S. small-company portfolios, we are seeing a different market than we did during most of 2020. The breadth of active management appears to be finally turning a corner as markets seem to be focusing more on investment fundamentals and valuations than on growth. Still, there has been a junk-rally component to small caps as companies without any earnings continue to outperform, just to a lesser degree than previously. Portfolio positioning remained the same, with the largest overweights to value-, quality- and stability-oriented stocks. We are still looking to see more of a rebound in quality and stability.
The market environment has also been supportive for our international equity portfolios. With value stocks enjoying positive earnings momentum, we have been witnessing positive earnings revisions. Generally speaking, our value managers were already positioned for this environment, and therefore maintained their pro-cyclical bias. While our momentum weighting remained roughly the same, its composition began to change. As the COVID-19 selloff started to disappear from the trailing one-year data, quantitative and momentum managers have been more positive on cyclical sectors such as financials and energy and less positive on defensive sectors. This rotation looks to have some staying power, and our portfolios may begin to shift to a more pro-value, pro-cyclical position as a result.
Emerging-markets equities, especially in Russia and South Africa, have gotten a boost from the rebound in energy prices. Our portfolios have mostly maintained their positioning from the prior period. Frontier markets have struggled a bit compared to emerging markets; where applicable, we have trimmed frontier weights.
Canadian inflation has been relatively weak, although gasoline prices have been a notable area of strength. The Bank of Canada is looking for inflation to move closer to its 3.0% upper-end target boundary; we may get there simply by rebasing the year-ago data to the depressed COVID-crash inflation numbers. Higher headline prints could spook some investors, but they may also just be transitory. The Canadian yield curve is moving higher, similar to other global yield curves. However, with higher short-term rates and lower long-term rates than many other countries, the domestic curve is flatter. We believe the Bank of Canada has become a huge player in the Canadian bond market and now has the ability to initiate yield-curve control. We are overweight corporate credit and underweight duration and spread duration—this positioning should help mitigate some of the impact from rising rates. We have concerns with the slow pace of vaccination as compared to other developed markets. The housing market is also a concern as prices have been rapidly increasing.
High-yield bonds spreads widened somewhat after hitting historic heights in mid-February. Performance has generally been stronger for lower-rated issuers. The high-yield market has held up reasonably well given the rise in U.S. Treasury yields and fairly significant outflows.
Glossary
A bear market refers to a market environment in which prices are generally falling (or are expected to do so) and investor confidence is low.
A bull market refers to a market environment in which prices are generally rising (or are expected to do so) and investor confidence is high.
Cyclical stocks or sectors are those whose performance is closely tied to the economic environment and business cycle. Managers with a pro-cyclical market view tend to favour stocks that are more sensitive to movements in the broad market and therefore tend to have more volatile performance.
Growth stocks exhibit steady earnings growth above that of the broader market.
Hedging is an investment technique designed to try to limit potential losses from swings in market value (price changes) of stocks, bonds, commodities or currencies. This is generally achieved by purchasing equally weighted and opposite exposure in two different markets.
High-yield debt is rated below investment grade and is considered to be riskier.
Issuance is the sale of securities, typically with regard to debt instruments such as bills, notes and bonds.
Momentum stocks are those whose prices are expected to keep moving in the same direction (either up or down) and are not likely to change direction in the short term.
Option-adjusted spread refers to a calculation used to help determine price differences between similar products that allow different embedded options.
The price-to-earnings (P/E) ratio is the ratio for valuing a company that measures its current share price relative to its per-share earnings (EPS).
The price-to book (P/B) ratio compares the market value of a company to its net assets.
Quantitative easing (QE) is a form of unconventional monetary policy in which a central bank purchases longer-term securities from the open market in order to increase the money supply and encourage lending and investment.
A rebased index measures its returns relative to a base year, which sets the price of the index to 100 on a given date.
The yield curve represents differences in yields across a range of maturities of bonds of the same issuer or credit rating (likelihood of default). A steeper yield curve represents a greater difference between the yields. A flatter curve indicates the yields are closer together.
Yield-to-worst a measure of the lowest yield that can be received on a bond that operates within the terms of its contract without defaulting.
Value stocks are those that are considered to be cheap and are trading for less than they are worth.
Index Definitions
The Bloomberg Barclays EM Local Currency Government Index measures the performance of local-currency emerging-market sovereign debt.
The Bloomberg Barclays EM USD Aggregate Index measures the performance of emerging-market debt issued in U.S. dollars.
The Citigroup Economic Surprise Index is an objective and quantitative measures of economic news, defined as the weighted historical standard deviations of data surprises (actual releases versus Bloomberg survey median).
The Consumer Price Index measures changes in the price level of a weighted average market basket of consumer goods and services purchased by households. A consumer price index is a statistical estimate constructed using the prices of a sample of representative items whose prices are collected periodically.
The Commodity Research Bureau Raw Industrial Commodity Price Index is a measure of price movements of 22 sensitive basic commodities whose markets are presumed to be among the first to be influenced by changes in economic conditions. It serves as one early indication of impending changes in business activity.
The MSCI ACWI ex USA Index is designed to measure the performance of developed- and emerging-market countries, excluding the U.S.
The MSCI Canada Index is designed to measure the performance of large- and mid-cap stocks in Canada.
The MSCI Emerging Markets Index is a free float-adjusted market-capitalization-weighted index designed to measure the performance of global emerging-market equities.
The MSCI Emerging Markets Growth Index measures the performance of large- and mid-cap stocks exhibiting overall growth style characteristics across 27 emerging-market countries.
The MSCI Emerging Markets Value Index measures the performance of large- and mid-cap stocks exhibiting overall value style characteristics across 27 emerging-market countries.
The MSCI France Index is designed to measure the performance of large- and mid-cap stocks in France.
The MSCI Germany Index is designed to measure the performance of large- and mid-cap stocks in Germany.
The MSCI Japan Index is designed to measure the performance of large- and mid-cap stocks in Japan.
The MSCI United Kingdom Index is a free float-adjusted market-capitalization-weighted index designed to measure the performance of large- and mid-capitalization stocks in the U.K.
The MSCI USA Index measures the performance of the large- and mid-cap segments of the U.S. market.
The MSCI World Index is a free float-adjusted market-capitalization-weighted index that is designed to measure the equity-market performance of developed markets.
The MSCI World ex USA Index is a free float-adjusted market-capitalization-weighted index that is designed to measure the equity-market performance of developed markets, excluding the U.S.
The Nikkei 225 Index is a stock market index for the Tokyo Stock Exchange. The Nikkei measures the performance of 225 large, publicly owned companies in Japan from a wide array of industry sectors.
The Personal Consumption Expenditures (PCE) Price Index is the primary inflation index used by the Federal Reserve when making monetary policy decisions.
The S&P 500 Growth Index is a measure of U.S. growth stocks using three factors: sales growth, the ratio of earnings change to price, and momentum.
The S&P 500 Value Index measures U.S. value stocks using three factors: the ratios of book value, earnings, and sales Important Information
SEI Investments Canada Company, a wholly owned subsidiary of SEI Investments Company, is the Manager of the SEI Funds in Canada.
The information contained herein is for general and educational information purposes only and is not intended to constitute legal, tax, accounting, securities, research or investment advice regarding the Funds or any security in particular, nor an opinion regarding the appropriateness of any investment. This commentary has been provided by SEI Investments Management Corporation (“SIMC”), a U.S. affiliate of SEI Investments Canada Company. SIMC is not registered in any capacity with any Canadian regulator, nor is the author, and the information contained herein is for general information purposes only and is not intended to constitute legal, tax, accounting, securities, or investment advice, nor an opinion regarding the appropriateness of any investment. You should not act or rely on the information contained herein without obtaining specific legal, tax, accounting and investment advice from qualified professionals. This information should not be construed as a recommendation to purchase or sell a security, derivative or futures contract. You should not act or rely on the information contained herein without obtaining specific legal, tax, accounting and investment advice from an investment professional. This material represents an assessment of the market environment at a specific point in time and is not intended to be a forecast of future events, or a guarantee of future results. There is no assurance as of the date of this material that the securities mentioned remain in or out of the SEI Funds.
This material may contain "forward-looking information" ("FLI") as such term is defined under applicable Canadian securities laws. FLI is disclosure regarding possible events, conditions or results of operations that is based on assumptions about future economic conditions and courses of action. FLI is subject to a variety of risks, uncertainties and other factors that could cause actual results to differ materially from expectations as expressed or implied in this material. FLI reflects current expectations with respect to current events and is not a guarantee of future performance. Any FLI that may be included or incorporated by reference in this material is presented solely for the purpose of conveying current anticipated expectations and may not be appropriate for any other purposes.
There are risks involved with investing, including loss of principal. Diversification may not protect against market risk. There may be other holdings which are not discussed that may have additional specific risks. In addition to the normal risks associated with investing, international investments may involve risk of capital loss from unfavourable fluctuation in currency values, from differences in generally accepted accounting principles or from economic or political instability in other nations. Emerging markets involve heightened risks related to the same factors, in addition to those associated with their relatively small size and lesser liquidity. Bonds and bond funds will decrease in value as interest rates rise.
Information contained herein that is based on external sources is believed to be reliable, but is not guaranteed by SEI Investments Canada Company, and the information may be incomplete or may change without notice.
Commissions, trailing commissions, management fees and expenses all may be associated with mutual fund investments. Please read the prospectus before investing. Mutual funds are not guaranteed, their values change frequently and past performance may not be repeated.


