Economic Outlook: Winter Hibernation (Long Version)
- COVID-19 and efforts to contain it will continue to make headlines and influence the Canadian and global economies in the New Year.
- The promise of widely available vaccines in developed countries has encouraged a risk-on, pro-cyclical posture.
- While we have seen increasing evidence of a “Great Rotation” from growth to value and cyclical investing, we believe it is too early to tell if this is the beginning of a major secular shift in equity investment themes.
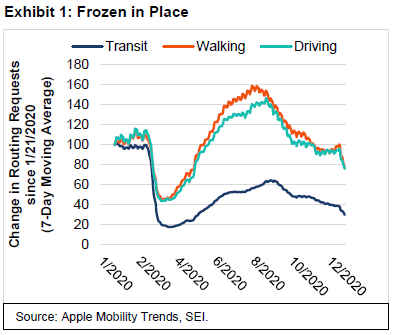
As if a typical Canadian winter isn’t long and dark enough, this one will likely seem longer and darker owing to the novel coronavirus. According to economic consultancy Capital Economics, the nation is subject to one of the most stringent lockdown regimens of any major country—surpassed only by the restrictions imposed upon Italy and the U.K. Mobility data from tech giant Apple shows that all forms of movement (including driving, walking and using public transport) fell off a cliff in March as Canadians sheltered in place during the first wave of the virus (Exhibit 1). As warmer weather arrived and infection rates receded during the spring and summer months, mobility rates appear to have increased; although transit trends lagged significantly. September brought another round of restrictions as the second wave of COVID-19 cases hit. While it’s hard to separate virus-related restrictions on movements from more seasonal weather-related declines in activity, we believe the lag in transit usage shows that pandemic-driven contraints remain a severe economic depressant.
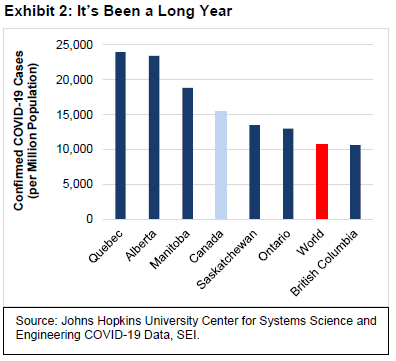
The precautions have helped to keep infections, deaths and hospitalizations much lower than in the U.S. and other hard-hit countries. Nonetheless, the more populous provinces have recorded high rates of confirmed infections when adjusted for population size (Exhibit 2). Quebec, Alberta and Manitoba each reported in excess of 18,000 confirmed COVID-19 cases (per million) in 2020. Those numbers are on par with the rates recorded in Russia and Germany, but amounted to just 35% of the U.S. total for the year.
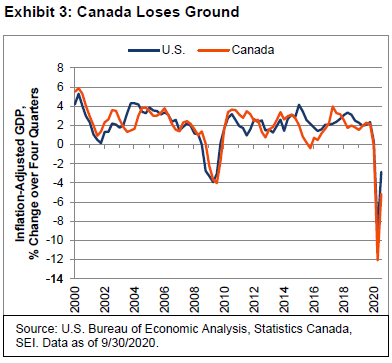
Canada’s aggressive approach toward social distancing has come at an economic cost. This is illustrated in Exhibit 3, which tracks the four-quarter change in the country’s inflation-adjusted (real) gross domestic product (GDP) over the past 20 years compared to that of the U.S. Over the entire 20-year period, the difference in GDP growth over each four-quarter span averages out to be a tiny 0.03% in favour of the U.S. The strong correlation should be no surprise given the close economic ties the two countries share. However, the performance differential has widened immensely during the COVID-19 crisis. In the second quarter of 2020, Canada’s GDP tumbled 12.1% from the year-ago level, while the U.S. suffered a 9.0% decline—a difference that amounted to 3.1 percentage points. That’s their largest recorded spread on GDP outcomes over the two-decade period. In the third quarter, the difference in the countries’ GDP growth narrowed to a still-substantial 2.3 percentage points.
There also has been a fiscal cost of restrictions during the crisis, as the Canadian government has pulled out all the stops to support the economy. Its Fall Economic Statement 20201 estimates that the federal deficit for the fiscal year ended March 31 will total more than C$380 billion, or 17.5% of GDP. Of this amount, some C$275 billion represents its COVID-19 response plan. The deficit is anticipated to shrink to 5.1% of GDP in fiscal year 2022 and to 2.1% in 2023, but this outcome depends upon the speed at which the economy returns to more normal conditions.
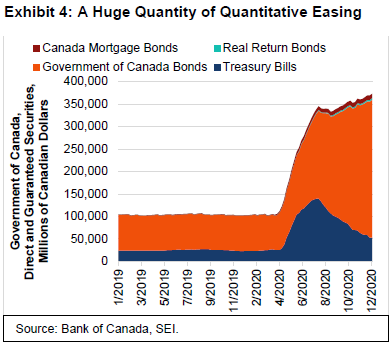
As has been the case in other central banks around the world, the Bank of Canada’s (BOC) bond-buying program has offset the explosion of government debt issuance that would otherwise have placed pressure upon financial markets. Exhibit 4 highlights the huge increase in the BOC’s holdings of government securities since March 2020—particularly Government of Canada Bonds, which jumped from C$100 billion at the end of March to $370 billion as of December 16. Those purchases essentially offset the all of the expected treasury issuance associated with the pandemic response plan for the current fiscal year. These totals exclude more than C$14 billion of provincial bonds, which the BOC did not hold prior to May.
At SEI, we expect the BOC to maintain an extraordinarily expansive monetary policy stance. Since lowering its overnight policy rate from 0.75% to 0.25% on March 27 (two weeks after the U.S. Federal Reserve lowered its federal-funds rate from 1.25% to 0.25%), the central bank has announced that it will keep the rate pegged at 0.25% through 2021 and 2022. This should limit the extent to which bond yields rise at the longer end of the yield curve. However, we do expect some upward pressure in longer-term maturities as investors anticipate the return to a more normal environment. In our view, portfolios that have less-than-benchmark duration risk and are positioned for prospective curve steepening should benefit.
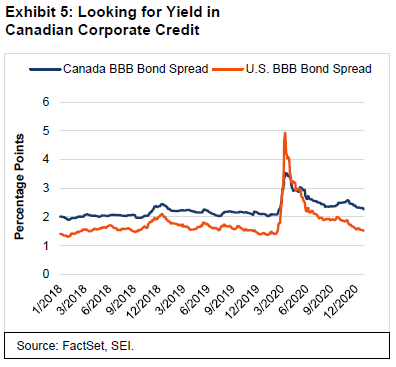
Corporate bonds seem better positioned versus their duration-matched government counterparts as they offer a relatively reasonable yield pickup. We believe those yield spreads are likely to grind lower over the coming months as corporate fundamentals improve and default risks subside alongside economic recovery. The biggest challenge for the corporate bond market would likely be a quick and forceful return to active balance-sheet re-leveraging on the back of debt-funded merger-and-acquisition or share-buyback activity. A bias toward corporate bonds would probably be favourable over the next year.
Exhibit 5 compares the BBB rated bond spreads for Canadian and U.S. corporate credits. Excluding the panic months of March and April, U.S. BBB yield spreads have tended to trade below Canadian spreads over the past three years. Canadian yield spreads are 77 basis points wider than their U.S. counterparts as of the end of 2020, about 30 basis points more than the three-year average. We expect this differential to narrow in 2021, as Canadian corporates will likely outperform non-credit fixed-income assets.
Canadian equities, meanwhile, have failed to keep up with the U.S. stock market. In local-currency terms, the MSCI Canada Index (total return) gained just 5.5% in 2020 (as of December 29) versus a 20.8% gain for the MSCI USA Index (total return). As Exhibit 6 illustrates, equities have been a relative performance laggard since the end of the global financial crisis.
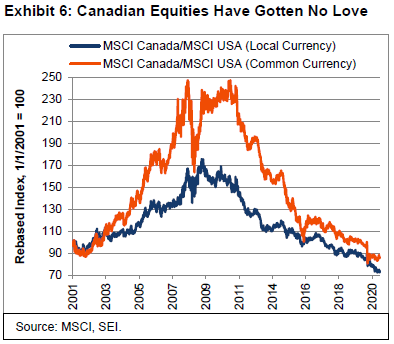
In local-currency terms, peak performance of Canadian equities came in mid-2009 as economic recession was coming to an end. The relative performance peak in common-currency terms came later, in March 2011, courtesy of the Canadian dollar’s extended bull market. The Canadian equity market’s heavy exposure to financials and energy has been a major drag on performance for years, as has a small weighting to the information technology sector.
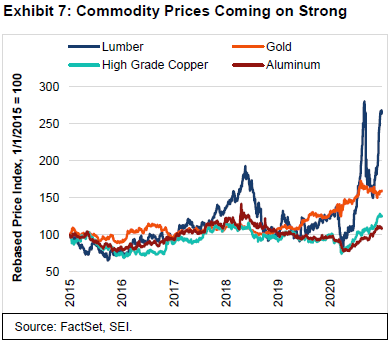
We expect the laggards to play catchup in 2021. Energy, materials and other cyclical sectors of the equity market pushed sharply higher in November, in tandem with positive news on the vaccine front. Additionally, the bounce in global economic activity during the second half of the year, led by China’s strong economic performance, has caused commodity prices to surge. There are several factors that could help sustain the positive price trends of economically sensitive commodities during 2021: last year’s implementation of the United States-Mexico-Canada trade accord; the general lowering of trade tensions with the U.S.; and the promise of even better trade relations between the U.S. and many of its allies under President-elect Joe Biden’s administration. Exhibit 7 highlights the recent gains in gold and in industrial commodities aluminum, copper and lumber. Lumber prices have been a big winner since March thanks to the home-construction boom in North America.
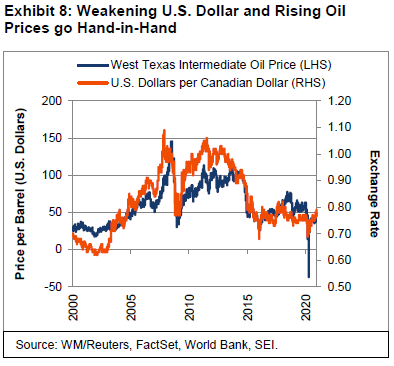
Also helping the trend in commodity prices has been the U.S. dollar weakening since March. Exhibit 8 shows the close correlation between oil prices and fluctuations in the U.S. dollar/Canadian dollar exchange rate. One of our key assumptions is a weak U.S. currency, on balance, in the years ahead. That would increase the relative attractiveness of non-U.S. assets, and should provide an especially favourable backdrop for commodity prices. As an important commodity-producing country, Canada’s stock market and currency should, in our view, benefit from this emerging trend.
The World Gets a Shot in the Arm
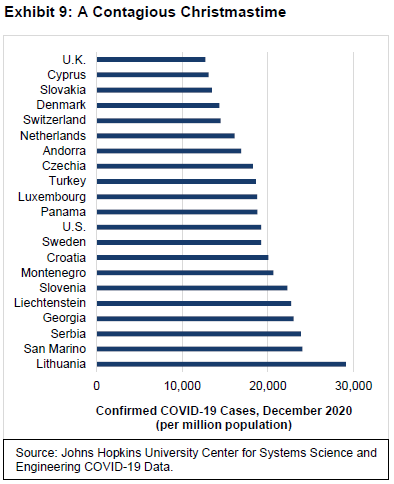
Good-bye, 2020—and good riddance! We’re all looking forward to a better 2021. Unfortunately, when it comes to the havoc wreaked by SARS-CoV-2 (the virus that causes COVID-19), the beginning of the New Year appears to be no better than the end of the last one. According to one organization that tracks the daily course of the virus, EndCoronavirus.org, nearly 100 countries currently need to engage in strong action to bring the virus to heel. By comparison, at the peak of the first wave in mid-April, 84 countries were reporting a high and/or rising infection rate. During June, conditions improved modestly in the Northern Hemisphere as the warmer weather arrived—yet the virus was just extending its reach into the Southern Hemisphere for its winter season.
Several countries in Eastern and Central Europe remained hard hit, as measured by newly confirmed cases per million (Exhibit 9). Unfortunately, the U.S. still had one of the highest infection rates in the world, reporting nearly 20,000 confirmed cases per million people during the month of December alone. Health officials expect this monthly rate to further accelerate during January, in the aftermath of the holidays. Some Western European countries (Austria, France, Greece, Italy and Spain) have recorded downturns in new cases following lockdowns and other mitigation actions that forced social distancing and reduced mobility. While such measures have helped to cut down the infection rate, they likely caused overall economic activity in those areas to contract during the fourth quarter. The U.K. experienced a particularly sharp surge in infections last month associated with a mutation of COVID-19 that is more contagious.
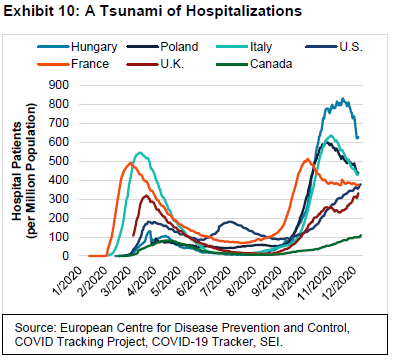
Infection rates, however, don’t tell the full story. We likely will never know the true extent to which people around the world have been infected due to testing limitations, including an absence of testing for countless asymtomatic cases. The trend in hospitalizations is a better, but still imperfect, measure for policy makers when it comes to the difficult decision to close businesses and impose limits on gatherings. However, there is no global, aggregated database of hospitalizations upon which to draw.
Exhibit 10 highlights the levels of COVID-19-related hospitalizations in select countries with accessible data (U.S., Canada, U.K., France, Italy, Poland and Hungary). In Italy, France and Poland, the number of hospital patients with COVID-19 appears to have peaked, yet remains near the high levels recorded during the spring. Hospitalizations in Hungary also appear to have peaked, although the country still reported 700 patients per million population as of year-end—outpacing all other countries that we examined. Hospitalizations in the U.S., the U.K. and Canada, by contrast, have continued to rise.
As for the U.S., this is the third wave of COVID-19 trouble. The first wave in the spring was mostly limited to New York, New Jersey, and other states in the Northeast. The second wave hit the rest of the country, particularly the southern and western states, with California, Texas, Florida and Arizona enduring some of the biggest outbreaks at that time. This third wave is even broader in scope, with few areas of the country left unscathed. According to COVID Act Now, another data aggregator that tracks the virus, Hawaii is the only state that has reported a slow rate of disease growth. Three states (Arizona, California and Tennessee) had severe outbreaks as of the end of December, while the rest of the country either already had active outbreaks or were at risk of having one. Hospital intensive care units reached constrained capacity in eight states, while an additional 19 states reported elevated capacity.
This situation prompted yet another round of restrictions on businesses and households during the fourth quarter. Exhibit 11 shows the Federal Reserve Bank of Dallas’ Mobility and Engagement Index (MEI)2 and the Federal Reserve Bank of New York’s Weekly Economic Index (WEI)3. The MEI is based on geolocation data collected from a large sample of mobile phone devices throughout the U.S. It measures the pandemic-driven deviation from typical pre-pandemic mobility behaviours in January and February. The WEI is composed of 10 high-frequency indicators of U.S. economic activity that reflect consumer behaviour, the labour market, and production; it is scaled to align with the four-quarter change in U.S. inflation-adjusted gross domestic product (GDP).
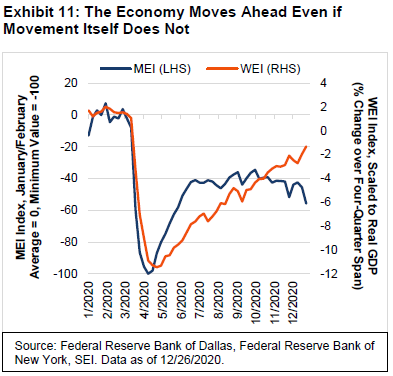
For the U.S. as a whole, mobility data show a flattish trend since June. Economic activity, on the other hand, has managed to continue its improvement from the lows of April and now appears to be just 2.5% off its year-ago level (implying that the economy is still operating at almost 5% below capacity). The economic data point to another strong gain along the lines of a 10% seasonally adjusted annual rate during the fourth quarter versus the prior three-month period.
The steady rise in weekly economic activity seen in Exhibit 11 can be chalked up to a few different factors. First, a large portion of the U.S. population has been able to continue working and shopping virtually. Second, manufacturing and construction have recovered soundly even as services of many kinds continue to struggle. Third, the income-support programs passed in the spring and the emergency lending facilities established by the Federal Reserve (Fed) succeded in preventing a downward spiral in consumption and employment. Household saving rates are still considerably above normal levels, which provides a cushion for the economy as a whole; although we acknowledge that individual circumstances vary enormously.
As has been the case through much of the pandemic, the extent of governmental restrictions—and adherence to them—differed dramatically from state to state during the fourth quarter. California and New York have been two of the most restrictive states when it comes to enforcing social-distancing, while Florida and Texas have had few restraints. State mobility data corroborate this disparity, with the MEI readings for Florida and Texas about half those of California and New York.
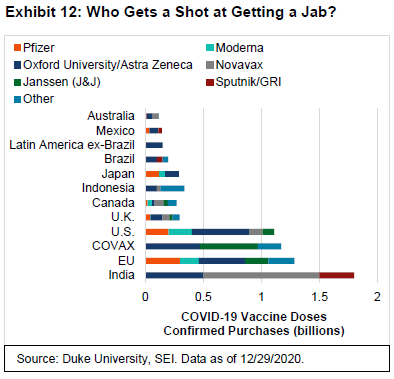
Although there is a danger that U.S. business activity could be throttled by additional lockdown orders during the first quarter of 2021, investors appear to be looking beyond the valley. The promise of vaccines being widely available in the U.S. and other developed countries has been enough to encourage a risk-on, pro-cyclical posture. Exhibit 12 tracks the number of vaccine doses purchased by various countries/regions.
The U.S. has already committed to buying one billion doses, enough to give more than 3.4 jabs to each person in the country (several vaccines require two separate shots that must be administered three or four weeks apart in order to be fully effective). The EU is in about the same position as the U.S. in terms of per-capita doses purchased. Canada, meanwhile, is set to receive enough doses to inject each of its residents nine times. Countries with middle-income economies listed in the chart (India, Indonesia, Brazil and Mexico) so far have commited to enough vaccines to fully protect only about half of their populations. COVAX, a facility founded by the World Health Organization, European Commission and the government of France to purchase and distribute vaccines to lower-income emerging economies, will need help if there is hope for vaccinating the bulk of the world’s population.
Get ready. Get set. Rotate.
The roll-out of surprisingly effective vaccines has energized the rotation into cyclical stocks. Exhibit 13 examines the total-return performance of the S&P 500® Index by style relative to the S&P 500® Index over the past five years. These style-specific indexes are published by S&P Dow Jones, a division of S&P Global4.
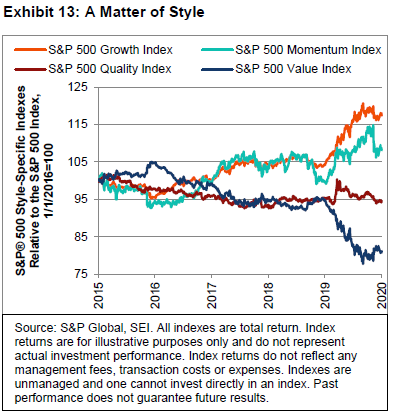
It should surprise no one that growth and momentum stocks were the big winners of 2020. Although they represent separate investing styles, the composition of the two indexes are currently dominated by information technology stocks (about 40% of both indexes), with the communication services, consumer discretionary and health care sectors also well represented in both indexes. They also share six companies in their top-10 constituents by index weight.
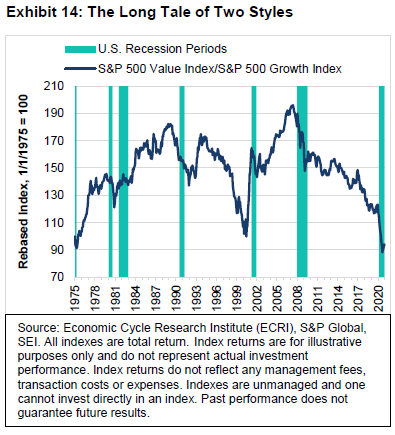
The big laggard has been the value style. Again, this is not a surprise. This index has relatively low exposure to the sectors where strong performance has been concentrated. It also suffered from having high exposure to financials, amounting to nearly 20% of its market cap. The value index has been trailing other investing styles for a long time, as the Exhibit 13 shows. In fact, its relative performance actually peaked in March 2007, when the global financial crisis began to hit the financial sector with its full fury. The pandemic of 2020 has had a similar impact. Exhibit 14 focuses on the S&P 500® Growth and Value Indexes to provide a richer historical context, beginning in 1975. In terms of relative total-return performance, the value style has underperformed growth by an even greater degree over the past 13 years than it did in in the 1990s tech boom.
In our third-quarter 2020 Economic Outlook (“Regime Change”), we argued that there was increasing evidence pointing to a major rotation from the growth and momentum investing styles to a renewed focus on value-oriented and more cyclical areas of the equity market. We noted that changes in stock-market leadership in favour of cyclical and traditional value sectors often occur around recession periods. We also pointed out that the long period of outperformance among mega-company technology stocks since the global financial crisis led to extremes in valuations and market-cap concentration—extremes that were exceeded in the past half century only during the early-1970s peak of the “Nifty Fifty” craze and the late-1990s tech bubble. While conceding that technology and other stay-at-home stocks were big winners as a result of the pandemic, we noted that even the best companies will not be the best stock-market performers forever.
We also cited a variety of reasons for anticipating a major change in investment regimes—including a deceleration in the earnings growth of the favoured few from super-fast to merely fast; an acceleration in the revenue and earnings growth of laggards in response to a vaccine and ramping-up of a return-to-work trend; a shift in the political winds that could lead to higher taxes and more aggressive anti-trust enforcement against the big social media and other leading technology companies; and a rise in bond yields that would harm high-multiple growth stocks more than low-multiple value stocks.
Ultimately, the change in investing regimes played out in a big way in November and the first half of December—and we expect the nascent trend to reassert itself over the course of 2021. Sticking with the S&P 500® style indexes, the S&P 500® Value Index bottomed at the beginning of September, with the S&P 500® Growth Index making a top on the same day. However, the big moves in relative performance came on November 9, the day Pfizer and BioNTech announced the surprisingly strong efficacy results of their COVID-19 vaccine. No one knows if this is the turn in the relative fortunes of these style indexes, but we think investors will prove willing to shrug off the likely prospect of more bad news during the difficult days and months that lay immediately ahead in the world’s battle against the virus. The focus will turn instead to the rising odds that the world will be in a better place economically as we enter the second half of 2021.
Be prepared for bumps in the road
Financial markets may still encounter challenges. For example, although the COVID-19 vaccine trials produced promising safety results, there could be unanticipated adverse reactions as people are inoculated more broadly. In the worst-case scenario, this could either force a temporary pause in the inoculation effort for specific vaccines or limit their distribution to a smaller portion of the general population. Those with severe allergies are already are being discouraged from getting the Pfizer vaccine after some people had serious reactions to their first dose.
Even if safety profiles become well established, the distribution of COVID-19 vaccines will nonetheless be a complicated and mammoth exercise. Just the process of giving two doses a few weeks apart to about 180 million people over the age of 16 in the U.S. alone (assuming 70% participation) has already proved challenging to achieve quickly and efficiently, with the number of vaccinations delivered falling far short of projections at the close of 2020.
Manufacturing challenges are also evident. Russia reported great difficulty in ramping up the production of its vaccine. In the U.S., biopharmaceutical company Pfizer cut December shipments of its vaccine in half. Elsewhere, two vaccines—one developed by British-Swedish company AstraZeneca in partnership with the University of Oxford, and one developed by French company Sanofi in partnership with British company GlaxoSmithKline—have run into delays that will slow their approvals for emergency use in the U.S. Logistical snafus are another likely hurdle.
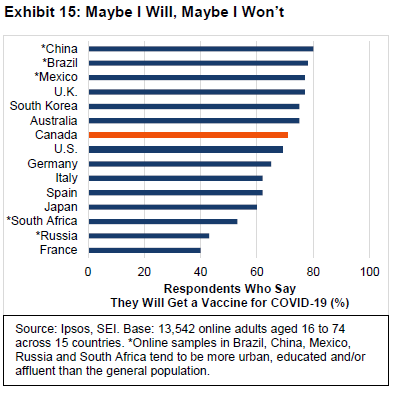
Finally, there is the issue of consumer willingness to get inoculated. Although the high efficacy of the vaccines may soften reluctance, a survey conducted by market research company Ipsos in December indicated that only 69% of the respondents in the U.S. appear willing to get the vaccine. This is comparable to the percentages recorded in several other developed countries, including Germany, Italy and Spain. The French are even more skeptical, as seen in Exhibit 15. Since health experts believe that herd immunity is generally achieved when 70% or more of the population is exposed to the virus or is vaccinated, a return to normalcy depends critically on overcoming this reluctance to take a vaccine that has been fast-tracked like no other.
Biden: His time
In 2021, the successful production and delivery of the vaccines will be the two most important factors that determine the pace of U.S. economic recovery and sustained rotation in market leadership away from pandemic winners to a broader selection of stocks and investment styles. However, politics will also come into play, acting as either a tailwind or a headwind. The U.S. Congress struggled for months trying to get additional income support to the people and businesses most seriously affected by the economic disruptions caused by the virus. They finally came up with a $900 billion compromise. Although amounting to more than 4% of the country’s GDP, the stimulus package is limited in scope and falls far short of what is necessary for economic recovery (it does not address revenue shortfalls facing state and local governments, and most of the benefits are set to expire in March or April of 2021). Even if a last-minute attempt by lawmakers to increase one-time payments to individuals stalls in the Senate, there will likely be more emergency actions after President-elect Biden enters office on January 20.
The outcome of Georgia’s run-off election on January 5 should be helpful for financial markets, as it reduces political uncertainty. Still, getting legislation through Congress probably won’t get any easier. The distribution of power remains so finely balanced that it will still be difficult to pass anything without substantial compromise and prolonged negotiations. Still, a Democratic-run Senate has significant implications. The party will have control over the chamber’s agenda, be able to enact smoother passage of Cabinet-level and judicial appointees and lead the oversight committees that have become a potent political weapon in the hands of the opposition.
Unified Democratic control will also ease the passage of legislation that increases taxes on corporations and high-income individuals, although that may be a battle that doesn’t take place until after the economy is back on its feet, post-pandemic. During the first few months of his tenure, President-elect Biden is likely to simply reverse many executive orders of his predecessor, re-imposing environmental, consumer, labour and other regulations that will add to the cost of doing business.
On the other hand, some of the measures that had been promoted by various Democratic politicians and activists before the November elections —such as eliminating the Senate filibuster, packing the Supreme Court or admitting Puerto Rico and the District of Columbia as states in order to give a structural advantage to Democrats in future elections—now appear dead in the water. The elections were, in one sense, a victory for the moderates and the center of the political spectrum. If President-elect Biden wants to get things done, he will often need to follow a middle course that reaches across the aisle.
Janet + Jay: So happy together
Policy depends on personnel, and there is no disputing that the priorities of a Biden administration will be quite different from those of the Trump era. One of the most important nominations put forth by President-elect Biden is that of former Fed Chair Janet Yellen as Treasury Secretary. If the Senate approves—and we expect she will enjoy substantial bipartisan support—the Treasury and the Fed are likely to work together in a fashion not seen since the days of World War II, when the central bank held interest rates at fixed levels in order to smoothly fund the war effort. Such a close working relationship between the Treasury and the Fed will probably be reassuring for investors in the near term, since there is little doubt that the central bank will continue its extraordinary efforts to support the economic recovery in 2021. That’s good news for the economic outlook and for firms that face high debt levels.
A sustained rotation out of the high-multiple growth stocks to the lowly-valued cyclical and financial stocks is dependent, to an important extent, upon a rise in bond yields and a widening of the yield-curve spread. Exhibit 16 highlights this interest-rate sensitivity, comparing Treasury yield-curve movements to the relative performance of the S&P 500® Financials Index against the S&P 500® Information Technology Index. Over the past decade, the relationship has been extremely close. As bond yields declined and the yield curve narrowed, banks and other financial stocks lagged the information technology sector. Financial companies have been hurt by the squeeze on their net interest margins. Meanwhile, share prices of high-growth technology firms have been bolstered by the secular decline in bond yields and the sheer magnitude of their earnings growth and cash flow; the present value of their future earnings and cash flow streams rise as the discount rate falls.
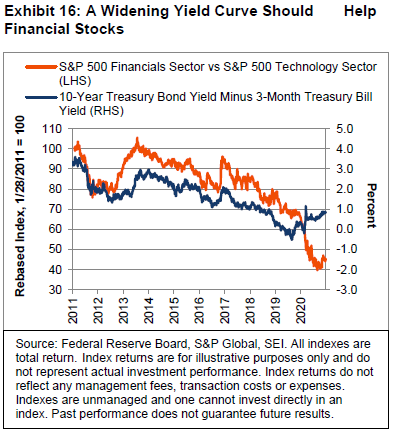
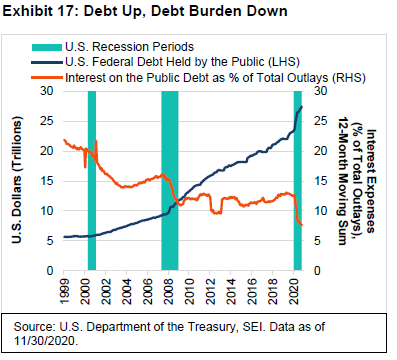
At the start of 2020, the 10-year Treasury bond yielded 1.9%. It currently yields just under 1%, which is still below the likely future rate of inflation. While it may seem sensible to predict further increases in bond yields, there is a possibility that the Fed will actively suppress that rise via quantitative easing and yield-curve control operations in 2021. SEI’s portfolio managers are penciling in only a modest rise of 25 to 50 basis points in the 10-year Treasury bond from its current level. We think central banks around the world share the goal of keeping a fairly tight rein on yields across the maturity spectrum in order to limit their governments’ debt-service burdens. Exhibit 17 shows that the U.S. government’s interest expense as a percentage of total outlays fell sharply in 2020, even as federal debt held by the public soared. Actual interest expense, measured as a 12-month moving sum, fell from a peak of $582 billion in April to $509 billion in November.
Even after the COVID-19 crisis passes, governmental pressure will likely be placed on the Fed to continue to suppress the cost of debt. One of the key dangers of working hand-in-glove with the Treasury is the possible loss of some Fed independence. It’s certainly not a problem now, but what happens if inflation increases well beyond the the central bank’s 2% target? Will it allow interest rates to rise in order to lean against that acceleration in inflation, or will policymakers feel obligated to continue assisting the federal and state governments by keeping rates lower than they otherwise would be? Additionally, inflation is a time-honored method of reducing the real debt burden at the expense of savers. The pressure to allow inflation to run hotter than it has at any time in the past two or three decades could well intensify in the years ahead.
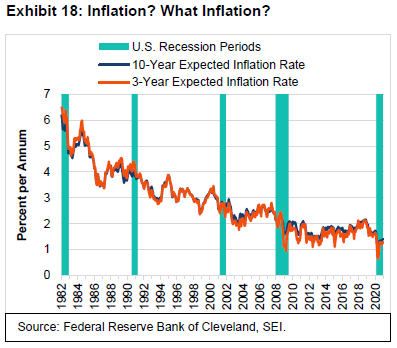
Investors apparently are not anticipating such an outcome. The Federal Reserve Bank of Cleveland publishes data that tracks expected inflation over a range of periods, from one year to 30 years. In Exhibit 18, we highlight the average projected rate over the next 3 and 10 years. These estimates are calculated by the Cleveland Fed with a model that uses Treasury yields, Consumer Price Index (CPI) inflation data, inflation swaps and survey-based measures of inflation expectations. By its estimates, consumer-price inflation will average just 1.3% over the next three years and 1.4% over the next decade. By comparison, the 3-year Treasury note currently yields only 0.18%. The 10-year bond is at 0.95%. Even after the economic recovery of the past seven months and the likelihood of further improvement in 2021, inflation expectations remain near the low end of the range recorded since the global financial crisis.
As economic activity normalizes in the year ahead, there probably will be some upward pressure on prices. Whether markets respond to that inflation acceleration depends on how sustained it turns out to be. Among the key measures we use in our analysis of inflation is the trend in compensation costs, productivity, and unit labour costs. The change in unit labour costs equals the change in compensation minus the change in productivity. Exhibit 19 examines the three-year annual rate of change in unit labour costs versus the price index for personal consumption expenditures (PCE) excluding food and energy—the Fed’s preferred measure of inflation.
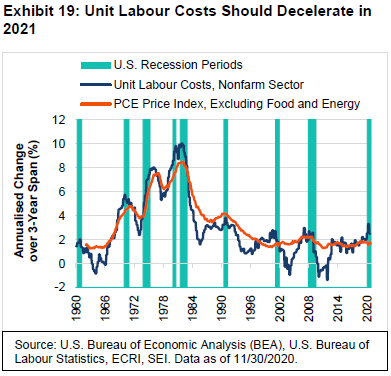
Even when smoothed over a three-year period, unit labour costs for the nonfarm business sector are more volatile than the actual inflation rate. But we think it’s still useful as a measure of the underlying inflation trend.
A benign view of inflation in the near term is based on the observation that unit labour costs tend to decline significantly during the early stages of an economic recovery. In the last economic cycle, the three-year per-annum change in unit labour costs peaked at 3% in the first quarter of 2007 and fell to a low of -1.4% by the fourth quarter of 2011. Core inflation, measured by the PCE price index (excluding food and energy), fell from a peak of 2.2% in March 2007, hitting a low of 1.3% in March 2011. It usually takes about two or three years after a recession ends for unit labour costs to bottom out. It takes a while for labour markets to tighten, leading to stronger compensation increases. Productivity also tends to fade as the economy approaches full employment of resources.
Exhibit 20 looks at the two inputs of unit labour unit costs, total labour compensation and productivity. The three-year annualized change in labour compensation peaked in the second quarter of 2020 at 5.5%, near the highest levels recorded in the past 35 years. This spike in compensation is misleading, however. Through the end of 2019, the pace of compensation gain was only 3.4% per annum. In 2020, the nonfarm business sector recorded quarterly spikes of 9.2% in the first quarter and 24.3% in the second quarter at seasonally adjusted annual rates because this statistic is heavily influenced by the types of workers who have jobs.
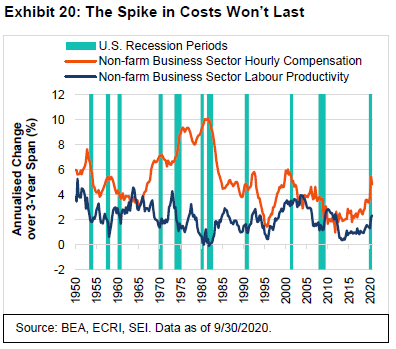
The lockdowns and other social-distancing measures have led to proportionately bigger layoffs in lower-paid service jobs than in higher-paid manufacturing, construction, or professional occupations. This shift in the composition of U.S. employment explains why productivity also moved higher, jumping 10.6% at an annual rate in the second quarter of 2020 from the previous quarter.
As the world returns to normal, compensation growth will likely decelerate significantly, as will productivity growth. Once normalization is achieved—probably in 2022—we should have a better idea of where productivity and costs really are. Under the Biden administration, however, we could see measures implemented that would tend to increase wages and benefits in the form of a higher national minimum wage, additional health-care benefits, or executive orders that favour the priorities of organized labour. Under a best-case scenario, any sustained rise in compensation growth would be matched by a similarly sustained rise in productivity. If that doesn’t happen, unit labour costs will rise, profit margins will erode and inflation will accelerate.
The key consideration is the outlook for productivity. Optimistic economists argue that the pandemic has accelerated investment in robotics, cloud computing and artificial-intelligence software. They expect the implementation of virtual meetings and other work-at-home innovations will lead to the kind of bump in productivity seen during the tech boom of the late 1990s and early 2000s. It is certainly an attractive theory, but it will still take years to play out. In the meantime, we think it pays to be alert to the possibility that the current explosion in the growth of money and credit, combined with the political pressures on the Fed to ease the fiscal strains facing governments at all levels, could lead to unexpected inflation pressures in the years beyond 2021. The current soon-to-be cozy relationship between the Fed and the Treasury will not last forever.
Brexit and COVID-19 make it hard to stay calm and carry on
The last-minute Brexit deal provided a Christmas gift of sorts (at least in terms of removing a degree of uncertainty). But in a year when most countries have been under severe economic and financial stress, the U.K. has endured more pain than most. Exhibit 21 highlights the degree to which the its economy lagged other major nations through the first three quarters of 2020. The U.K. economy did rather well between 2010 and 2019, with real GDP rising by a cumulative 19.0%. While lagging the U.S. (+24.9%) and Canada (+22.7%), it was in line with the performance of Germany over that time span. Meanwhile, France (+13.6%), Japan (+9.2%) and Italy (+1.7%) were the true laggards.
Since the end of 2019, however, U.K. inflation-adjusted GDP has contracted more sharply than the other six countries highlighted in Exhibit 21. The country recorded a horrendous 21.2% cumulative slide over the first half of 2020. By comparison, France and Italy contracted by 18.9% and 17.8%, respectively. Japan (-8.7%) and the U.S. (-10.1%) suffered the least in the first half of the year. Despite the U.K.’s sharp 16.0% rebound off the trough during the third quarter, it still lags all the other listed countries in the year to date.
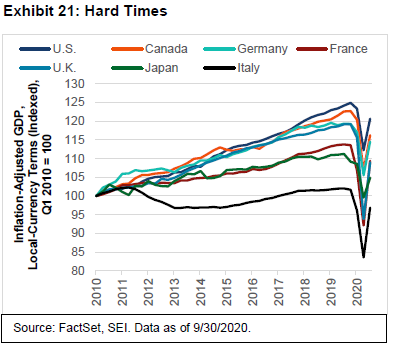
The U.K. also reports GDP on a monthly basis. The best month was June, when monthly GDP jumped by 9.1%—but the gains have eased progressively since then, most recently logging a advance of 0.4% in October. Given the re-imposition of mobility restraints in November and December, which we highlight below, it would not be surprising if U.K. GDP data turned negative during the final month of the year.
Earnings expectations follow the economic trends. Exhibit 22 illustrates at the forward price-to-earnings ratio of the MSCI United Kingdom, MSCI Europe ex UK and MSCI USA Indexes.
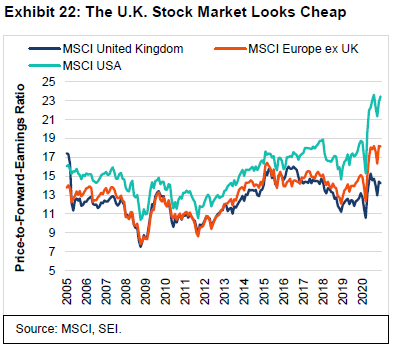
The U.S. market has consistently traded at a premium valuation over the past 15 years, but that premium has widened since 2017 owing to the boom in growth stocks relative to the more value-laden U.K. and European equity markets. In 2020, that premium valuation has expanded significantly. The other two markets have mostly traded at similar valuations to each other over time. But a major divergence began to develop in 2019 and became more pronounced in 2020.
While the pandemic dominated the economic backdrop, the prospect of Brexit made matters worse. The U.K.’s departure from the EU promised to be messy and full of uncertainties from the start. At this time last year, we figured that some sort of deal with the EU would eventually be made in order to avoid a “hard” Brexit. That turned out to be the case, although the negotiations went on for as long as they possibly could before the December 31 departure date. The result is a “skinny” deal that allows the U.K. to gain preferential, tariff-free, access to the EU market for its goods as long as it follows many of the EU’s rules and regulations as they apply to governance, labour and the environment. If those standards change in the future, the U.K. will be permitted to deviate from them and challenge future disputes in an independent court.
While a skinny deal is better than none, the U.K. has suffered from a long period of intense uncertainty (which continues to a degree, as Brexit addressed the transfer of goods but not commerce in services). Firms have been playing defense in anticipation of the country’s departure from the trading bloc, trying to build up inventories to guard against near-term shortages and supply disruptions. The government has warned consumers that fresh fruit and vegetables may be in short supply over the next few months. Trucks have been piling up on both sides of the EU-U.K. border over the past several weeks due to the surge in import volumes caused by precautionary stockpiling along with the usual Christmas rush and the slowdowns related to the added safety measures resulting from the pandemic. Barriers to trade introduce economic inefficiencies, whether they be tariffs or additional inspections and paperwork. Post-Brexit, prices will likely be a bit higher, GDP a bit lower and supply chains a bit more unreliable.
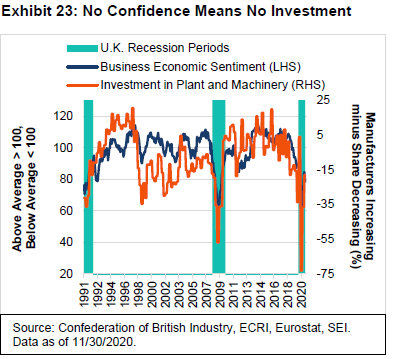
Exhibit 23 shows that the drop in U.K. business sentiment during 2020 was accompanied by a slide in plant and equipment investment activity (the latter statistic is an equally weighted average of capital spending activity at capital goods, intermediate goods and consumer goods manufacturers, as surveyed by the Confederation of British Industry). Although there was a rebound in the third quarter, more manufacturers continued to cut back on capital spending than increase spending. Business sentiment, meanwhile, fell sharply in November following a five-month recovery as worries over Brexit and the pandemic returned.
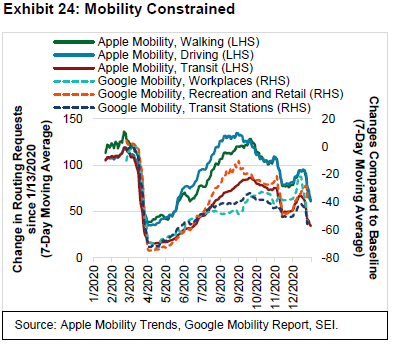
Unfortunately, COVID-19 cases surged again in London and other parts of southeast England during the final months of 2020, leading to another round of business closures as well as many other severe restraints on social gatherings. As of year-end, some 75% of England is in Tier 4 lockdown (including London and Greater Manchester), while most of the rest of country is in Tier 3 lockdown5. These restrictions are reflected in the mobility data reported by Apple and Google, which we show in Exhibit 24.
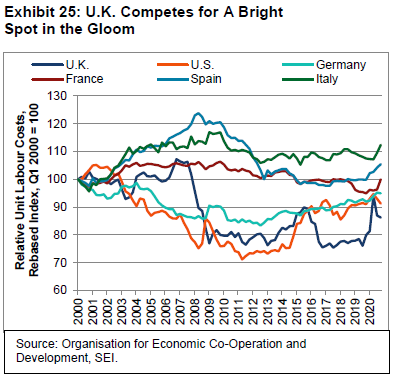
In all, it’s been winter of discontent in the U.K. However, equity valuations, in our opinion, already reflect much of the bad news. Maybe it is time for investors to think about the things that could go right. First, of course, is the development and distribution of the vaccines, which are expected to drive the global economy to higher ground in 2021. This should benefit the large energy, materials and industrial multinationals that make up nearly one-third of the market capitalization of the MSCI United Kingdom Index. Second, the U.K. appears competitive versus other advanced countries when measured by various benchmarks, such as relative unit labour costs, which we present in Exhibit 25.
Even Brexit may turn out to be less of a nightmare than many people fear. The government’s trade negotiators have already fanned out across the world to make sure that the U.K. retains the same trade agreements that it has enjoyed as a member of the EU. U.K. Prime Minister Boris Johnson has also backed away from his attempt to renege on the withdrawal agreement that allows Northern Ireland to trade with Ireland and the rest of the EU without border restrictions. This decision saves a lot of headaches, especially with the U.S. president-elect’s administration having threatened to impose trade sanctions if the treaty was abrogated. In any event, we expect the impact of the virus—good or bad—to swamp any Brexit effects not only in the near term, but throughout 2021.
As we mentioned earlier in this report, infection rates and hospitalizations in some parts of Europe have decreased. In France, for example, the daily infection rate dropped from an early-November rate of about 800 per million population to around 200 per million by year end—with President Emmanuel Macron one of the more recent victims. On the other hand, Germany, the Netherlands, Sweden and much of emerging Europe (Turkey, especially) saw a sharp ramp-up in cases that necessitated severe social-distancing restrictions.
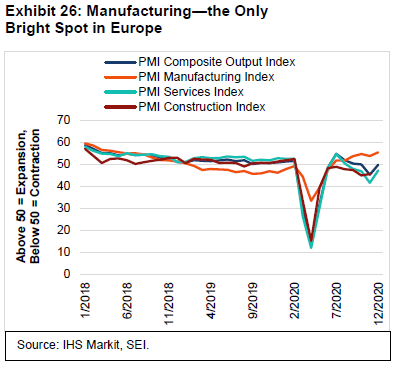
Purchasing managers in the eurozone generally reported deteriorating economic conditions in the second half of the year, which we show in Exhibit 26. The composite Purchasing Managers Index (PMI) from IHS Markit recorded a strong bounce off the April lows, yet peaked in July before slipping below the 50 line in October—indicating a contraction in business activity—and tumbling further in November. Service industries led the way lower, slipping into contraction in September and moving more deeply into recession territory during October and November. Construction activity was more resilient, yet remained below pre-pandemic levels. The manufacturing sector was the stand-out winner, falling less sharply during the spring lockdowns than the other sectors and continuing to signal robust growth—with the eurozone PMI manufacturing index finishing the year at its highest level since August 2018.
If global equity markets witness a sustained broadening out of performance from a large-cap growth/technology and U.S.-dominated focus, the eurozone and other European countries should participate. The top-three sector weightings in the MSCI EMU Index as of the end of November, for example, are consumer discretionary (16.5% of the total market cap), industrials (15.1%) and financials (14.3%). The information technology sector has the fourth-largest capitalization weight in the Index, amounting to 11.9%. That weighting is similar to the combined weight of the highly cyclical materials and energy sectors (11.3%). By contrast, information technology accounts for 28.2% of the total market capitalization of the MSCI USA Index.
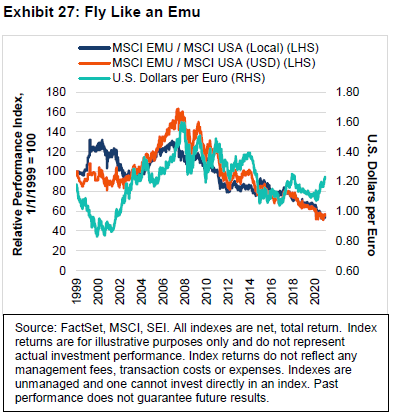
Exhibit 27 tracks the relative performance of the MSCI EMU Index (total return) versus the MSCI USA Index (total return) in local-currency and U.S. dollar terms since 1999. Through much of this period, the countries that make up the eurozone lagged the U.S., especially in U.S. dollar terms. In local-currency terms, there have been periods of meaningful outperformance against U.S. equities coinciding with a sharp depreciation of the U.S. dollar against the euro. However, in 2020, eurozone equities continued to lag the performance of the U.S. stock market in both local-currency and U.S. dollar terms despite the U.S. dollar’s weakening trend since March.
Like so many other relationships in the equity market, the underperformance of the eurozone benchmark has been going on for a long time, although for good reason. The European economy is more cyclical, value-oriented and less dynamic than the U.S. economy. Regulations are more constraining and less shareholder-friendly. Taxes and government spending represent a larger proportion of the economy. Profit margins and returns on invested capital are lower. But none of these considerations rules out a cyclical rebound in equity performance against the U.S. stock market at a time when the latter appears to be excessively tilted toward technology stocks as the U.S. dollar is weakening and a global economic recovery is at hand thanks to the game-changing introduction of effective vaccines.
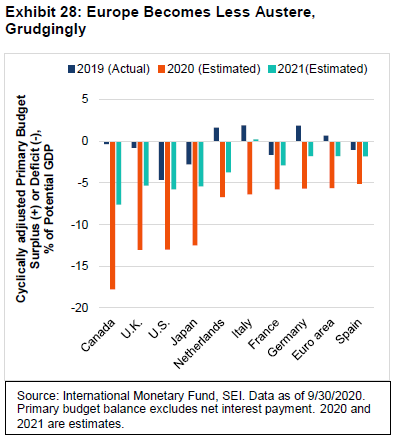
The pandemic has had one good outcome for Europe. It finally forced Germany and other fiscal “hawks” to allow an expansion in fiscal policy. This move away from budgetary austerity should be viewed in context. Exhibit 28 compares the increase in the primary fiscal deficit as a percentage of potential GDP for a handful of major developed countries. All the countries have experienced a sharp rise in red ink this year, measured by the International Monetary Fund (IMF). The biggest deficits are outside the eurozone, with the euro area as a whole moving from a 0.7% of GDP surplus in 2019 to a deficit of 5.6%, a swing of 6.3 percentage points in the government budget balance as a result of changes in government expenditure and tax policies (referred to as a fiscal impulse). By contrast, Canada, the U.K., the U.S. and Japan were already in deficit in 2019, but provided an even larger fiscal impulse to their economies than Europe did.
The Europeans probably can afford to run higher deficits than those that the IMF appears to be penciling in for 2021. Italy almost certainly will. The memory of the European periphery debt crisis is still fresh in the minds of many policymakers; they realize that pushing for fiscal austerity measures prematurely would probably be a mistake. On the other hand, we think there is greater need for other countries outside the eurozone to regain control of their finances. If those countries fail to do so, Europe could be the beneficiary of investment flows that would further prop up the euro and equity valuations.
In the meantime, the European Central Bank (ECB) appears ready and willing to do what it can to support the region’s economy. As Exhibit 29 shows, the ECB’s balance sheet expanded dramatically in 2020, climbing nearly 50% to almost €7 trillion. At its December meeting, the Governing Council expanded its Pandemic Emergency Purchasing Programme (PEPP) by an additional €500 billion and extended the program until March 2022. The PEPP was established last March with the announcement of a €750 billion purchase target. It was expanded in June by €600 billion.
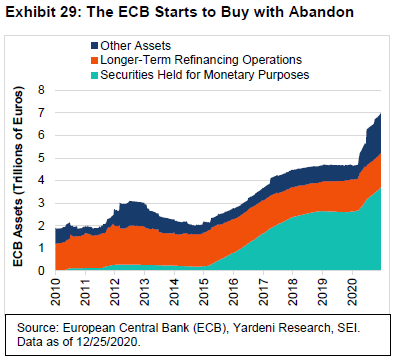
The ECB’s primary quantitative-easing tool, its asset-purchase programme, was created in January 2015. It was restarted in March 2020 and currently absorbs €20 billion of mostly government securities each month; although the program was enhanced to include the purchase of corporate securities and a greater proportion of the sovereign securities of the larger debtors in the eurozone. Finally, the terms of the central bank’s targeted long-term refinancing operations also were made somewhat more favourable recently to encourage further lending by the banking system.
These programs have provided liquidity to the financial markets and have encouraged banks to lend to households and businesses, as we show in Exhibit 30. Through October, lending to non-financial corporations has climbed by 6.3% on a year-over-year basis.
This is in sharp contrast to the slowing of business lending between 2011 and 2013, when the periphery debt crisis was in full swing and the integrity of the monetary union was in considerable doubt. The various ECB programs also have helped to drive the bond yields of even the most problematic European debtor countries lower.
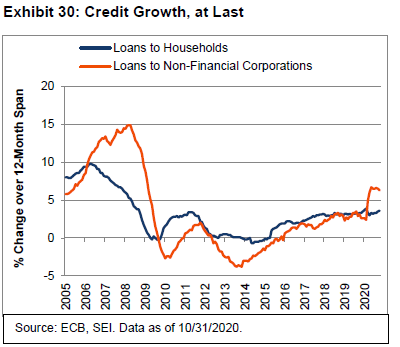
Exhibit 31 tracks the journey taken by the 10-year government benchmark bonds of the European periphery countries—Greece, Italy, Spain, Portugal and Ireland—versus German bunds since 2010. Periphery bond yields soared between 2010 and 2011, with Greece hitting a peak of nearly 35%, Portugal almost 16% and Ireland nearly 14%. These countries experienced another period of stress in 2015 and 2016, although the rise in yields at that time paled in comparison to the crisis years at the start of the decade.
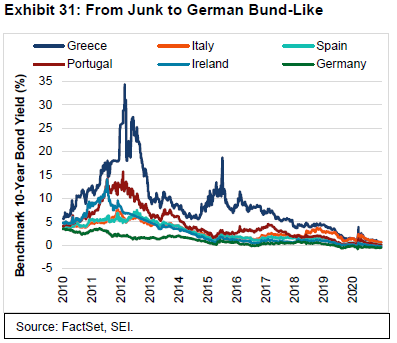
More recently, the pandemic-induced spike in periphery yields in mid-March has given way to new all-time lows for several countries. At year end, German bunds settled at -0.59%. Ireland’s 10-year benchmark bond also was negative, at -0.29%. Spain and Portugal were a handful of basis points above zero. Greece and Italy sported the highest yields, a mere 0.64% and 0.59%, respectively. These yields were all well below the 95 basis points that can be obtained investing in U.S. 10-year Treasurys. There should be little wonder why SEI’s global fixed-income portfolio managers look to corporate credit for income and are underweight duration to guard against a potential rise in yields from these rock-bottom levels.
Emerging markets turn the corner
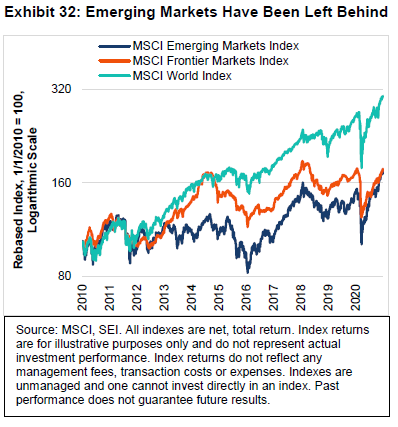
Emerging-market equities have been on a tear since they bottomed out last March, with the MSCI Emerging Markets Index (total return) soaring by more than 70% from the trough through the end of December. For 2020 as a whole, this measure of emerging-market equities climbed by 16.4%. This represents a slightly better performance than the 15.4% gain registered by the MSCI World Index (total return), a benchmark that tracks the performance of advanced-country stock markets. Exhibit 32, however, shows how difficult the last 10 years have been for developing equity markets.
Frontier markets have fared even worse. The MSCI Frontier Emerging Markets Index (total return) has yet to surpass its most recent pre-pandemic level recorded last January.
We are hopeful that the rally in emerging-market equities that began in March will continue. Central-bank actions have fostered global liquidity, as we show in Exhibit 33.
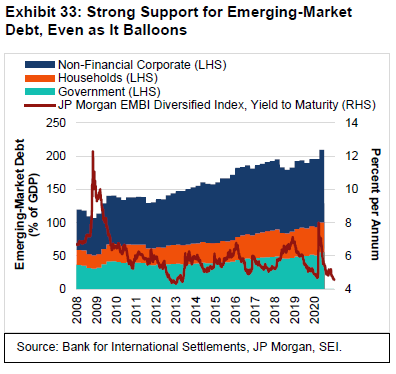
Not only has the combined firepower of global central banks prevented a liquidity crisis, it has also driven borrowing costs down to near-record lows—even as total emerging-market debt exceeds 200% of GDP. Only two problem debtors had to increase their interest rates in recent months to stem investment outflows. Argentina increased its policy rate by 200 basis in November; however, at a current level of 38%, it is still well below the 55% that prevailed at the beginning of 2020 and is less than half the rate it was in September 2019. Turkey was forced to drive rates higher in 2020 with a 200 basis-point hike in September, followed by a 475 basis-point jump in November. It was the only major country in the world that sported a higher policy rate at the end of 2020 than at the beginning.
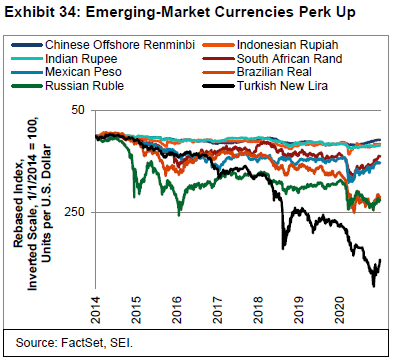
As the world returns to normal, other nations may need to raise rates in order to attract sufficient investment inflows to sustain their fiscal and current-account positions. They include major countries like Brazil, Russia and South Africa. As Exhibit 34 highlights, however, these countries currently are enjoying an appreciating exchange rate against the U.S. dollar. The Chinese renminbi, Indonesian rupiah and Indian rupee have held their own against the U.S. dollar in recent years, and were not hit anywhere near as badly as other emerging-market currencies during the March panic. The South African rand and the Mexican peso, meanwhile, have recovered the bulk of their losses since the spring. The rand certainly profited from the rise in the price of gold and other metals. The peso benefited from Mexico’s close economic ties with the U.S. and the bounce-back in its auto manufacturing and cross-border trade. The other countries in the chart (Brazil, Russia and Turkey) continue to see their currencies struggle a bit; but even these exchange rates have been rising against the U.S. dollar since early November.
A weak U.S. dollar is an important catalyst for emerging markets’ performance. Exhibit 35 tracks the relative performance of the MSCI Emerging Markets Index against the MSCI World Index and the U.S. Dollar Index® (DXY) since 2000.
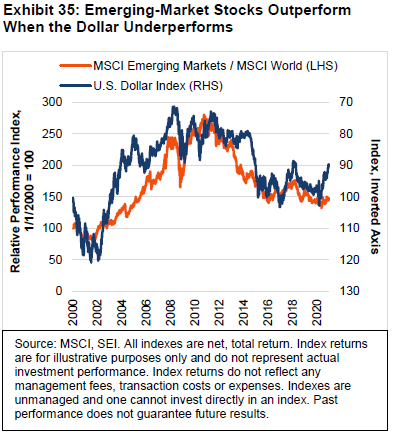
The first decade of this time span was marked by secular U.S. dollar depreciation (we inverted the right-hand axis so the line goes up as the U.S. currency declines in value). For much of this period, emerging markets handily beat the MSCI World Index. During the worst of the global financial crisis in 2008, the U.S. dollar appreciated massively as foreign-exchange investors rushed into safer assets, including the dollar. Emerging-market equities fell sharply relative to their developed-country counterparts. When China embarked on its debt-fueled recovery in late 2008, however, money flowed out of the U.S. dollar and back into emerging markets. Over the past 10 years, the U.S. dollar has been generally appreciating and emerging-market equities have performed dismally on a relative basis.
Although the U.S. dollar has weakened meaningfully this year, pushing emerging-market equities higher, the relative performance of the MSCI Emerging Markets Index to the MSCI World Index has been in a mostly flat and narrow range; we expect that the coming year will see emerging-market equities perform relatively better. One reason for our optimism is the projection that the U.S. dollar should continue to weaken. Exhibit 36 is a reminder that the dollar can be subject to long up-and-down cycles that can persist for years. In the current up-cycle, the U.S. dollar bottomed in 2011.
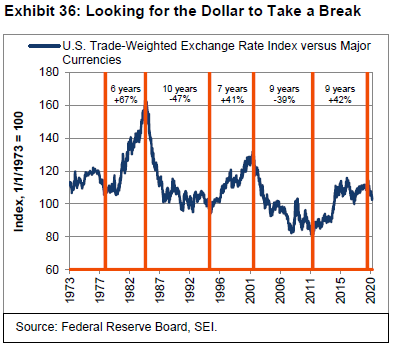
We thought for a while that the U.S trade-weighted exchange rate might have peaked in December 2016, but that proved untrue. As we saw in Exhibit 35, the U.S. dollar’s drop between December 2016 and January 2018 coincided with a big emerging-market rally, both in absolute terms and versus developed countries. The extension of the U.S. dollar’s bull market to its March 2020 peak, however, means that it has climbed by 42% over roughly nine years. The length of this cycle matches that of the previous decline from 2002 to 2011 and is generally in line with the length of up-and-down cycles going further back in time. The cumulative increase off the 2011 low, meanwhile, is eerily similar to the previous secular dollar bull market from 1995 to 2002.
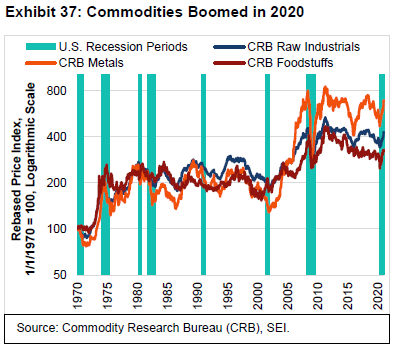
If the world economy enjoys a durable cyclical recovery in 2021, the U.S. dollar should continue to fall. This will also bolster the rally in commodity prices. Exhibit 37 shows that commodities of all sorts have been rallying sharply since the spring, when the world’s central banks and fiscal authorities came riding to rescue. This is the first time since 2009 to 2011 that metals, raw industrials and foodstuffs have all rallied at the same time. The rebound in Chinese economic activity certainly has been a factor. So has the U.S. dollar’s pullback and the promises made by the Fed and other major central banks to keep policy rates near zero for as long as it takes to get inflation up to a 2% (or higher) rate. And, of course, the expectation of better times to come as vaccines become available is a powerful source of hope for all investors to latch onto as a new chapter begins in the New Year.
What actions are our portfolio managers taking?
Recent market chatter has hinted at the notion of a “Great Rotation” in capital markets, suggesting that investors may have begun to favour value and cyclical sectors over growth names. While we have seen accumulating evidence of this, we believe it is too early to say definitively that this is the beginning of a major secular shift in equity investment themes. But we believe the time for a durable rotation is drawing near. Since September, value-style equity indexes have outpaced their growth counterparts to varying degrees across geographies and market capitalizations, most notably within U.S. large caps.
We also have observed several signs of potential normalization. In October, U.S. Treasury yields started to tick up, at least partially owing to markets pricing in a potential Democratic sweep in the November elections, which would be expected to yield a larger fiscal expansion in the coming quarters (the prospect of divided government is being viewed in an optimistic light too). The development of highly effective COVID-19 vaccines have helped investors shake off worries that the pandemic would last indefinitely. Meanwhile, regulatory developments in both the U.S. and abroad have hinted that the dominance of large technology companies may no longer be as straightforward, long-lasting or profitable as some investors have grown accustomed.
Over the next several years, signs of a value recovery should continue to reveal themselves. Economic activity will likely normalize as COVID-19 abates (via vaccines or herd immunity), while fiscal spending and accommodative central-bank policy should prop up inflation. As the market prices in these developments, “long-duration” growth and expensive high-profitability stocks should be pressured, while momentum investors are likely to rotate into new themes, potentially adding more fuel to the value rally.
Although leadership in the S&P 500® Index has rotated to the most expensive stocks, the managers in our U.S. large-cap portfolios prefer the less commodity-dependent areas of the value universe (such as health care and consumer staples) and companies with decent franchises and significant profitability. They have avoided economically sensitive areas of the market.
U.S. small caps performed well in November and December. Lower-quality stocks rallied, while higher-quality stocks lagged. Growth beat value in December. In our portfolios, managers trimmed from stability-oriented names in favour of deeper-value stocks. During the fourth quarter’s so-called “junk” rally, the portfolios’ momentum-oriented managers reduced their significant underweight to value and now are in line with the benchmark.
Within our international equity portfolios, value outperformed modestly in December. Higher-quality stability stocks performed well, and low-volatility stocks lagged. In our view, our momentum-oriented managers will signal whether the “Great Rotation” has become established. Momentum-oriented manager JO Hambro has not rotated its portfolios into reflationary trades; however, our two quantitative momentum managers modestly added to cyclical stocks within specialty chemicals, retailers and insurance. Some opportunistic profit-taking may be warranted if the portfolios need to raise cash to meet flows as weights of the value-oriented managers increased in November on relative performance. In general, our managers had little exposure to either extreme of the value-growth spectrum (deep-value junk stocks or highly speculative growth stocks).
In emerging-market equities, lower-quality companies performed well in the last weeks of 2020. China struggled on valuation grounds and U.S. trade restrictions; however, China A shares (mainland China-based companies that trade domestically on the two Chinese stock exchanges) have eked out decent performance. Our portfolios remained slightly overweight financials. They were also modestly overweight reasonably priced technology stocks, while avoiding the high-flying, expensive names in the sector. We have seen some rotation into value in Japan, where our portfolios were overweight industrials, machinery, auto components and specialty retail.
With investment-grade bond yields at historic lows, it’s not surprising to hear investors express concerns about their effectiveness in either a strategic portfolio or as standalone investments. Despite low interest rates and attractive equity returns, we believe that investment-grade bonds are an important and relevant tool for investors. We expect them to continue to offer a combination of better returns than cash and genuine diversification benefits relative to equities. In our view, those diversification benefits are particularly notable since equity risk typically dominates investors’ portfolios. If the economic recovery out of the current pandemic were to falter, we think exposure to bonds could help mitigate harm caused by a drop in stock prices. On the other hand, if economic growth strengthens, we would expect investment-grade bonds to hold their value given the outlook for continued low interest rates as a result of efforts by global central banks to support the economic recovery.
Within our core investment-grade fixed-income portfolios, our managers did not make any material changes to portfolio positioning during the quarter. They do not view inflation as an issue in the near term; however, longer-term pressures are building from deficit financing and supply-chain pressure. The Fed has indicated that any uptick in inflation is likely to be viewed as transient. The portfolios do not have an inflation hedge; although our managers did purchase Treasury inflation-protected securities (TIPS) in the spring, when they were cheap compared to U.S. Treasury securities. However, TIPS exposure has been reduced throughout the year. Allocations to U.S. Treasurys were higher than usual, with an overweight to 30-year Treasurys. Our managers have a preference for higher-yielding securities and hold a favourable view on securitized products (mortgages, credit cards, and auto and student loans). During the quarter, the overweight to corporate bonds was reduced in our portfolios.
Our high-yield managers did not make many changes during the quarter. New issuance continued at a record pace this year at $450 billion. An underweight to energy was maintained on the view that low energy prices will continue to pressure companies for some time. We continued to overweight CCC rated issues. Collateralized loan obligations remained the largest active weight in our portfolios. Managers have continued to monitor new issues and add to positions on valuation grounds.
Glossary
Absolute return is the gain or loss generated by a security or portfolio over a certain period of time.
Austerity refers to measures taken by a country’s government in an effort to reduce expenditures and a budget deficit.
A bull market refers to a market environment in which prices are generally rising (or are expected to do so) and investor confidence is high.
Cash flow is a formula used to measure a company's financial health by calculating the difference between money flowing into and out of a business in a given time.
A collateralized loan obligation is a security that is created by pooling together smaller, high-yielding fixed-income assets, such as bank loans. These pools are then packaged into various tranches according to credit quality, maturity or other qualities.
Cyclical stocks or sectors are those whose performance is closely tied to the economic environment and business cycle. Managers with a pro-cyclical market view tend to favour stocks that are more sensitive to movements in the broad market and therefore tend to have more volatile performance.
Duration is a measure of a security’s price sensitivity to changes in interest rates. Specifically, duration measures the potential change in value of a bond that would result from a 1% change in interest rates. Short duration bonds are less price-sensitive to changes in interest rates.
Growth stocks exhibit steady earnings growth above that of the broader market.
Hawk refers to a policy advisor that has a negative view of inflation and its economic impact and thus tends to favour higher interest rates.
Hedging is an investment technique designed to try to limit potential losses from swings in market value (price changes) of stocks, bonds, commodities or currencies. This is generally achieved by purchasing equally weighted and opposite exposure in two different markets.
High-yield debt is rated below investment grade and is considered to be riskier.
The International Monetary Fund (IMF) is an organization of 190 countries, working to foster global monetary cooperation, secure financial stability, facilitate international trade, promote high employment and sustainable economic growth, and reduce poverty around the world.
Issuance is the sale of securities, typically with regard to debt instruments such as bills, notes and bonds.
Momentum stocks are those whose prices are expected to keep moving in the same direction (either up or down) and are not likely to change direction in the short term.
The price-to-earnings (P/E) ratio is the ratio for valuing a company that measures its current share price relative to its per-share earnings (EPS).
Quantitative easing (QE) is a form of unconventional monetary policy in which a central bank purchases longer-term securities from the open market in order to increase the money supply and encourage lending and investment.
Securitized debt consists of a portfolio of assets (such as mortgages or bank loans) that have been grouped together and repackaged as individual securities.
The yield curve represents differences in yields across a range of maturities of bonds of the same issuer or credit rating (likelihood of default). A steeper yield curve represents a greater difference between the yields. A flatter curve indicates the yields are closer together.
Value stocks are those that are considered to be cheap and are trading for less than they are worth.
Index Definitions
The Consumer Confidence Index is an economic indicator published by The Conference Board to measure consumer confidence, defined as the degree of optimism on the state of the U.S. economy that consumers are expressing through their activities of savings and spending.
The Consumer Price Index measures changes in the price level of a weighted average market basket of consumer goods and services purchased by households. A consumer price index is a statistical estimate constructed using the prices of a sample of representative items whose
prices are collected periodically.
The Commodity Research Bureau Raw Industrial Materials Price Index is a measure of price movements of 22 sensitive basic commodities whose markets are presumed to be among the first to be influenced by changes in economic conditions. It serves as one early indication of
impending changes in business activity.
The Dow Jones Industrial Average measures the stock performance of 30 large companies listed on stock exchanges in the U.S.
The Federal Reserve Bank of Dallas’ Mobility and Engagement Index measures the deviation from the pre-pandemic mobility behavior of device users recorded during the January/February 2020 period. It summarizes information from seven different variables: fraction of devices leaving home in a day, fraction of devices away from home for three-to-six hours at a fixed location, fraction of devices away from home at a fixed location, an adjusted average of daytime hours spent at home, fraction of devices taking trips longer than 10 miles (16 kilometers), fraction
of trips less than 1.2 miles (2 kilometers), average time spent at locations from home.
The Federal Reserve Bank of New York Weekly Economic Index measures ten indicators of real economic activity, scaled to align with the four-quarter gross domestic product growth rate. It represents the common component of series covering consumer behavior, the labour market and production.
The JP Morgan EMBI Global Diversified Index tracks the performance of external debt instruments (including U.S.-dollar-denominated and other external-currency-denominated Brady bonds, loans, eurobonds and local-market instruments) in emerging markets.
The MSCI Canada Index is designed to measure the performance of the large- and mid-cap segments of the Canada market. With 88 constituents, the Index covers approximately 85% of the free float-adjusted market capitalization in Canada.
The MSCI Emerging Markets Index is a free float-adjusted market-capitalization-weighted index designed to measure the performance of global emerging-market equities.
The MSCI EMU Index covers large- and mid-cap representation across the ten developed-market countries in the European Economic and Monetary Union, representing approximately 85% of the free float-adjusted market capitalization.
The MSCI Europe ex UK Index is a free float-adjusted market-capitalization-weighted index designed to measure the performance of large- and mid-capitalization stocks across developed-market countries in Europe, excluding the U.K.
The MSCI Frontier Emerging Markets (FEM) Index captures large- and mid-cap representation across 34 frontier and emerging-markets countries. The Index covers about 85% of the free float-adjusted market capitalization in each country.
The MSCI United Kingdom Index is a free float-adjusted market-capitalization-weighted index designed to measure the performance of large- and mid-capitalization stocks in the U.K.
The MSCI USA Index measures the performance of the large- and mid-cap segments of the U.S. market. The Index covers approximately 85% of the free float-adjusted market capitalization in the U.S.
The MSCI World Index is a free float-adjusted market-capitalization-weighted index that is designed to measure the equity-market performance of developed markets. The Index consists of 24 developed-market country indexes.
The Personal Consumption Expenditures Price Index is the component statistic for consumption in gross domestic product collected by the United States Bureau of Economic Analysis. It consists of the actual and imputed expenditures of households and includes data pertaining to durable and non-durable goods and services.
The IHS Markit Purchasing Managers' Index (PMI) is an indicator of economic health for manufacturing and service sectors. Its purpose is to provide information about current business conditions to company decision makers, analysts and purchasing managers.
The Personal Consumption Expenditures (PCE) Price Index is the primary inflation index used by the Federal Reserve when making monetary policy decisions.
The PMI Construction Index measures the activity level of purchasing managers in the construction industry. A reading above 50 indicates expansion in the construction industry; a reading below 50 indicates contraction.
The PMI Manufacturing Index is a monthly indicator of U.S. economic activity based on a survey of purchasing managers at more than 300 manufacturing firms. It is considered to be a key indicator of the state of the U.S. economy.
The PMI Services Index is based on monthly questionnaire surveys collected from over 400 U.S. companies which provide a leading indication of what is happening in the private sector services economy.
The Russell 1000® Index includes 1,000 of the largest U.S. stocks based on market cap and current index membership; it is used to measure the activity of the U.S. large-cap equity market.
The Russell 2000® Index includes 2,000 small-cap U.S. stocks and is used to measure the activity of the U.S. small-cap equity market.
The S&P 500® Index is an unmanaged, market-weighted index that consists of 500 of the largest publicly traded U.S. companies and is considered representative of the broad U.S. stock market.
The S&P 500® Financials Index comprises those companies included in the S&P 500® that are classified as members of the GICS® financials sector.
The S&P 500® Growth Index is a measure of U.S. growth stocks using three factors: sales growth, the ratio of earnings change to price, and momentum.
The S&P 500® Information Technology Index comprises those companies included in the S&P 500® that are classified as members of the GICS® information technology sector.
The S&P 500® Momentum Index solely comprises constituents with high risk-adjusted price return momentum scores. The objective is to provide exposure to the momentum factor (the tendency of investments to exhibit persistence in their relative performance) in various markets using a rule-based methodology.
The S&P 500® Value Index measures U.S. value stocks using three factors: the ratios of book value, earnings, and sales to price.
The S&P 500® Quality Index is designed to track high-quality stocks in the S&P 500® Index by quality score, which is calculated based on return on equity, accruals ratio and financial leverage ratio.
The ICE U.S. Dollar Index® is a measure of the value of the U.S. dollar relative to a basket of foreign currencies, often referred to as a basket of U.S. trade partners' currencies. The Index goes up when the U.S. dollar gains strength when compared to other currencies.
Important Information
SEI Investments Canada Company, a wholly owned subsidiary of SEI Investments Company, is the Manager of the SEI Funds in Canada.
The information contained herein is for general and educational information purposes only and is not intended to constitute legal, tax, accounting, securities, research or investment advice regarding the Funds or any security in particular, nor an opinion regarding the appropriateness of any investment. This commentary has been provided by SEI Investments Management Corporation (“SIMC”), a U.S. affiliate of SEI Investments Canada Company. SIMC is not registered in any capacity with any Canadian regulator, nor is the author, and the information contained herein is for general information purposes only and is not intended to constitute legal, tax, accounting, securities, or investment advice, nor an opinion regarding the appropriateness of any investment. You should not act or rely on the information contained herein without obtaining specific legal, tax, accounting and investment advice from qualified professionals. This information should not be construed as a recommendation to purchase or sell a security, derivative or futures contract. You should not act or rely on the information contained herein without obtaining specific legal, tax, accounting and investment advice from an investment professional. This material represents an assessment of the market environment at a specific point in time and is not intended to be a forecast of future events, or a guarantee of future results. There is no assurance as of the date of this material that the securities mentioned remain in or out of the SEI Funds.
This material may contain "forward-looking information" ("FLI") as such term is defined under applicable Canadian securities laws. FLI is disclosure regarding possible events, conditions or results of operations that is based on assumptions about future economic conditions and courses of action. FLI is subject to a variety of risks, uncertainties and other factors that could cause actual results to differ materially from expectations as expressed or implied in this material. FLI reflects current expectations with respect to current events and is not a guarantee of future performance. Any FLI that may be included or incorporated by reference in this material is presented solely for the purpose of conveying current anticipated expectations and may not be appropriate for any other purposes.
There are risks involved with investing, including loss of principal. Diversification may not protect against market risk. There may be other holdings which are not discussed that may have additional specific risks. In addition to the normal risks associated with investing, international investments may involve risk of capital loss from unfavourable fluctuation in currency values, from differences in generally accepted accounting principles or from economic or political instability in other nations. Emerging markets involve heightened risks related to the same factors, in addition to those associated with their relatively small size and lesser liquidity. Bonds and bond funds will decrease in value as interest rates rise.
Information contained herein that is based on external sources is believed to be reliable, but is not guaranteed by SEI Investments Canada Company, and the information may be incomplete or may change without notice.
Commissions, trailing commissions, management fees and expenses all may be associated with mutual fund investments. Please read the prospectus before investing. Mutual funds are not guaranteed, their values change frequently and past performance may not be repeated.


