The Perils of Market Timing in a Golden Age of Earnings Growth
It’s quiet. Too quiet.
Film directors know that the best way to set the stage for the entrance of a howling T-Rex or a hungry great white shark is to let an eerie calm unsettle the audience.
Fortunately, real life doesn’t work that way. Investors can be assured that there’s no good evidence indicating that current conditions can reliably tell us anything about what will come next.
Why bring this up now? Some might say it had been too quiet in financial markets prior to the recent return of volatility. Stock markets have had a good run since early 2020 without experiencing much volatility. We wouldn’t be surprised to see a bit more volatility going forward, given some of the risks facing the global economy. But we believe the positives outweigh the negatives.
Shaken, or just stirred? Volatility and declines often provide firmer footing
We don’t believe that the possibility of higher volatility needs to be unsettling. The smooth, nearly straight-line portion of this recovery will eventually conclude; however, that doesn’t necessarily mean we’re headed toward a bear market or a recession in the near future.
Looking at the historical record for the MSCI World Index, we stratified periods of time by volatility, using the number of trading days with losses of 1% or more in a year to create groups (Exhibit 1).
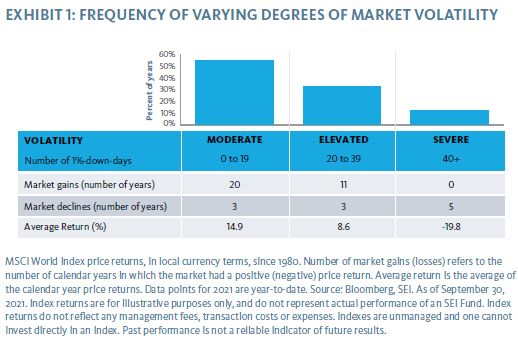
There’s a lot to feel positive about. The number of years that saw gains far exceeds those that suffered losses in both the moderate and elevated groups. Their average returns are also quite healthy relative to long-term average performance.
As for the severe-volatility group, there’s no denying its steep average losses, but this type of environment is rare, occurring only about 12% of the time. In our view, it’s much more likely that we move from a world of low or moderate volatility to one with elevated volatility, where markets continue to have a better chance of advancing, rather than declining.
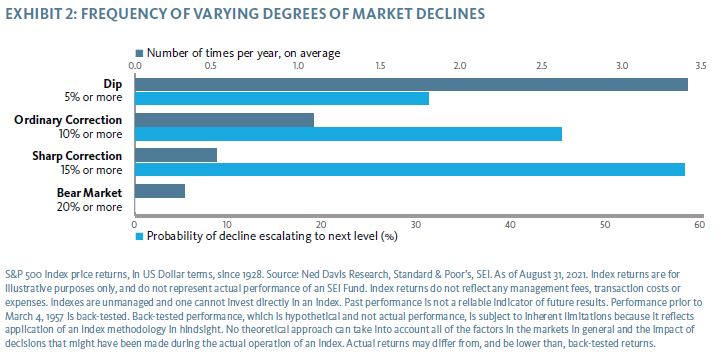
Exhibit 2 examines peak-to-trough declines rather than volatility. We can see both the average annual frequency of different-sized selloffs, as well as the likelihood that each will progress to the next.
For example, a 5% dip has slightly less than a 1-in-3 chance of growing into an ordinary correction which, in turn, has historically occurred a little more than once per year. Sharp corrections occur about once every other year on average.
Like periods of severe volatility, bear markets are rarer occurrences. Smaller market declines can happen quite often without approaching serious bear-market territory. Corrections are normal and can be healthy, often providing firmer footing for further advances.
Peak growth: A compelling cliffhanger
Moviemakers also love to rely on disorientation and the unfamiliar to keep the audience on the edge of their seats. Think about a scuba diver descending below the last reaches of sunlight or a climber scaling the face of a mountain in bad weather.
We may not be quite as captivated by evolving market dynamics, but plenty of investors may feel like they’re staring out over the edge of a cliff today. Equity markets have benefited from a period of sustained above-average rates of earnings growth—propelling them to new heights—and elevated valuations.
Naturally, the question of whether we’re witnessing peak growth conditions makes some investors nervous that we’re at (or near) a market top. We know these characteristics will not last forever, but we have not found any convincing evidence that a peak in earnings growth or high valuations suggests that we should expect the bull market to conclude any time soon.
We studied a long period of history dating back to 1900 to see what we could learn from the past. There were six similar periods over this time frame that were characterized by sustained robust earnings growth that coincided with elevated valuations (Exhibit 3).
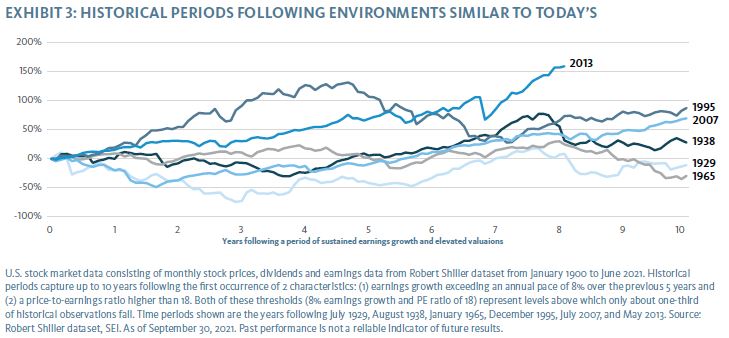
The market conditions we see today—elevated earnings growth and valuations—have not been clear indicators of a market top in the past, nor have they given any insight into the timing of the next major market decline. Only two of these six historical periods led to a market decline within the first year of the observation.
We looked at the 10-year period following each of these observations, so most of them contained a significant decline. But several didn’t experience a major selloff until the second half of the 10-year period. An anxious investor compelled to exit the market due to the presence of peak growth characteristics would have watched a long market advance from the sidelines during these periods.
Timing investments around market declines can be risky business
The filmmaker’s toolbox runs deep. One of the most unnerving devices that can be written into a screenplay is the “impossible choice.” The hero can only save one person, so who will it be? Time is running out and the chance of a safe resolution appears to be slipping away, but our protagonist can’t walk away now!
We should all be thankful that our options in the real world usually provoke less anxiety. But we sometimes still feel like we’re facing an impossible choice.
Perhaps the best approach in these situations is to pull the camera lens back to get a wider perspective (last movie metaphor, I promise).
The urge to sell investments when it feels like we’re near a market top is a self-imposed dilemma. Unless you have perfect foresight, our research suggests that attempting to time major portfolio changes around market peaks and troughs is a decision best skipped altogether.
Exhibit 4 provides a reminder that market timing requires two choices: when to sell, and when to buy back in. The costs associated with mistiming each of these decisions mount quickly.
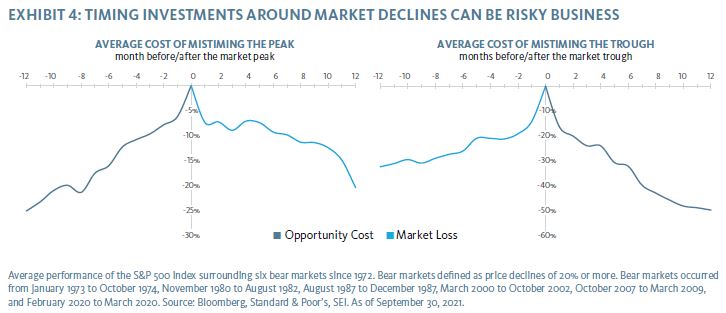
We calculated the average returns surrounding major market peaks and troughs since 1972. The left-hand side—the peak—shows the implied costs of mistiming the decision to sell, while the right-hand side—the trough—shows the penalty for mistiming the decision to buy back in.
A mistimed sale of only two months on either side of the peak equates to roughly 10% in losses or missed upside. The opportunity cost of an early exit can set an investor back by up to about 25%.
This double bind appears to hurt most when it comes to re-entering the market. A mistimed buy of only two months has cost investors an average of 20%, and a late re-entry of 12 months means investors have missed out on a gain of about 50%, on average. Front-loaded recoveries mean that the costs of market timing can stack up quickly.
SEI’s view
Perfect timing is elusive, if not impossible, in the real world. We expect investors to be well served by maximizing the amount of time that their assets are working in the market.
While we may be witnessing peak earnings growth, we’ve demonstrated why that’s not sufficient cause to deviate from strategic positioning. We believe the fundamental picture remains quite solid as businesses and households remain in strong financial health and there’s still upside for economic activity and labor markets.
We have high conviction that the recovery and its associated themes—stronger economic growth, gradually higher interest rates, firmer inflation, and changes in market leadership—will get back on track as the latest COVID-19 wave continues to moderate and global vaccination rates increase.
We expect the overall market trend to point upward, despite a potentially bumpier ride. Markets have a better chance of advancing, rather than declining, even when they enter periods of elevated volatility.
The best approach, in our view, is to maintain diversification across well-researched and established drivers of performance, like valuation and profitability. We believe this is a favorable environment for active management within equities—we’re able to avoid the most expensive areas of the market and can lean toward cyclical sectors and stocks. This environment should also be favorable for diversified fixed income, including credit and inflation-linked bonds, and other inflation-sensitive assets, such as commodities.
Glossary of Financial Terms
Active management: Active management is an investment strategy that attempts to outperform an investment benchmark index or target level of return or risk.
Bear market: A bear market refers to a market environment in which prices are generally falling (or are expected to fall) and investor confidence is low.
Bull market: A bull market refers to a market environment in which prices are generally rising (or are expected to rise) and investor confidence is high.
Credit: Credit refers to debt securities issued by companies, governments, and packaged (or securitized) consumer debt. Credit investments can include bonds, notes, mortgage-backed securities, and others.
Cyclical sectors: Cyclical stocks or sectors are those whose performance is closely tied to the economic environment and business cycle. Managers with a pro-cyclical market view tend to favor stocks that are more sensitive to movements in the broad market and therefore tend to have more volatile performance.
Dividend: A dividend is the distribution of corporate profits to eligible shareholders.
Inflation-linked bonds/Treasury inflation protected securities (TIPS): These types of investment instruments are typically indexed to an inflationary gauge to protect investors from the decline in the purchasing power of their money. Their principal value typically rises as inflation rises, while the interest payment varies with the adjusted principal value of the bond. The principal amount is typically protected so that investors do not risk receiving less than the originally invested principal.
Price-to-earnings ratio (PE): The PE ratio is equal to the market capitalization of a stock or index divided by its earnings over either the next 12 months (for a forward PE) or prior 12 months (for a trailing PE). The higher the PE ratio, the more the market is willing to pay for each dollar of annual earnings.
Recession: A recession is a period of broadly declining economic performance that lasts for several months or more.
Robert Shiller dataset (Exhibit 3): Monthly dividend and earnings data are computed from S&P 500 Index four-quarter totals for the quarter, with linear interpolation to monthly figures. Stock price data are monthly averages of daily closing prices.
Index Descriptions
MSCI World Index: The MSCI World Index is a free float-adjusted market-capitalization-weighted index designed to measure the equity market performance of developed markets. The Index consists of the following 23 developed-market country indexes: Australia, Austria, Belgium, Canada, Denmark, Finland, France, Germany, Hong Kong, Ireland, Israel, Italy, Japan, Netherlands, New Zealand, Norway, Portugal, Singapore, Spain, Sweden, Switzerland, the U.K. and the U.S.
S&P 500 Index: The S&P 500 Index is a market-capitalization-weighted index that consists of 500 publicly-traded large U.S. companies that are considered representative of the broad U.S. stock market.
Important Information
This material represents an assessment of the market environment at a specific point in time and is not intended to be a forecast of future events or a guarantee of future results. Positioning and holdings are subject to change. All information as of the date indicated. There are risks involved with investing, including possible loss of principal. This information should not be relied upon by the reader as research or investment advice, (unless you have otherwise separately entered into a written agreement with SEI for the provision of investment advice) nor should it be construed as a recommendation to purchase or sell a security. The reader should consult with their financial professional for more information.
Statements that are not factual in nature, including opinions, projections and estimates, assume certain economic conditions and industry developments and constitute only current opinions that are subject to change without notice. Nothing herein is intended to be a forecast of future events, or a guarantee of future results.
Certain economic and market information contained herein has been obtained from published sources prepared by other parties, which in certain cases have not been updated through the date hereof. While such sources are believed to be reliable, neither SEI nor its affiliates assumes any responsibility for the accuracy or completeness of such information and such information has not been independently verified by SEI.
There are risks involved with investing, including loss of principal. The value of an investment and any income from it can go down as well as up. Investors may get back less than the original amount invested. Returns may increase or decrease as a result of currency fluctuations. Past performance is not a reliable indicator of future results. Diversification may not protect against market risk.
Bonds and bond funds will decrease in value as interest rates rise. High yield bonds involve greater risks of default or downgrade and are more volatile than investment grade securities, due to the speculative nature of their investments. TIPS can provide investors a hedge against inflation, as the inflation adjustment feature helps preserve the purchasing power of the investment. Because of this inflation adjustment feature, inflation protected bonds typically have lower yields than conventional fixed rate bonds. Commodity investments and derivatives may be more volatile and less liquid than direct investments in the underlying commodities themselves. Commodity-related equity returns can also be affected by the issuer’s financial structure or the performance of unrelated businesses.
This material is not directed to any persons where (by reason of that person’s nationality, residence or otherwise) the publication or availability of this material is prohibited. Persons in respect of whom such prohibitions apply must not rely on this information in any respect whatsoever.
The information contained herein is for general and educational information purposes only and is not intended to constitute legal, tax, accounting, securities, research or investment advice regarding the strategies or any security in particular, nor an opinion regarding the appropriateness of any investment. This information should not be construed as a recommendation to purchase or sell a security, derivative or futures contract. You should not act or rely on the information contained herein without obtaining specific legal, tax, accounting and investment advice from an investment professional.
Information in the U.S. is provided by SEI Investments Management Corporation (SIMC), a wholly owned subsidiary of SEI Investments Company (SEI).
Information provided in Canada by SEI Investments Canada Company, the Manager of the SEI Funds in Canada.
Information issued in the UK by SEI Investments (Europe) Limited, 1st Floor, Alphabeta, 14-18 Finsbury Square, London EC2A 1BR which is authorised and regulated by the Financial Conduct Authority. Investments in SEI Funds are generally medium- to long-term investments.
The offer or invitation to subscribe for or purchase shares of the Sub-Funds (the “Shares), which is the subject of this Information Memorandum, is an exempt offer made only: (i) to “institutional investors” pursuant to Section 304 of the Securities and Futures Act, Chapter 289 of Singapore (the “Act”), (ii) to “relevant persons” pursuant to Section 305(1) of the Act, (iii) to persons who meet the requirements of an offer made pursuant to Section 305(2) of the Act, or (iv) pursuant to, and in accordance with the conditions of, other applicable exemption provisions of the Act.
SIEL has appointed SEI Investments (Asia) Limited (SEIAL) of Suite 904, The Hong Kong Club Building, 3 Jackson Road, Central, Hong Kong as the sub-distributor of the SEI UCITS funds. SEIAL is licensed for Type 4 and 9 regulated activities under the Securities and Futures Commission (“SFC”)
This information is being made available in Hong Kong by SEIAL. The contents of this document have not been reviewed by any regulatory authority in Hong Kong. You are advised to exercise caution in relation to the offer. If you are in any doubt about any of the contents of this document, you should obtain independent professional advice.
This information is made available in Latin America FOR PROFESSIONAL (non-retail) USE ONLY by SIEL.
Any questions you may have in relation to its contents should solely be directed to your Distributor. If you do not know who your Distributor is, then you cannot rely on any part of this document in any respect whatsoever.
Issued in South Africa by SEI Investments (South Africa) (Pty) Limited FSP No. 13186 which is a financial services provider authorised and regulated by the Financial Sector Conduct Authority (FSCA). Registered office: 3 Melrose Boulevard, 1st Floor, Melrose Arch 2196, Johannesburg, South Africa.


