Pullback in risk assets: Sound and fury, signifying nothing?
Some observers see the recent big moves in stocks, bonds, and currencies as evidence that the Federal Reserve (Fed) has been late to act and needs to deliver large cuts to the federal-funds rate to blunt the impact of a recession that may have already begun. Others see an opportunity to “buy the dip” that slashed stock prices 10%-20%. We see little reason to panic or to change our strategy.
The recent turbulence in the markets has little to do with any serious deterioration in the U.S. economy. To be sure, investors were shocked by the employment report issued on August 2. Not only did the unemployment rate rise, but employment growth in June and July turned out to be weaker than expected. While the headlines sound bad, our take on the labor market situation isn’t so gloomy. Consider that nonfarm payrolls still rose in July, although at a slower pace than we have seen in a while. Hurricane Beryl, which led to severe flooding in southern Texas, is partially to blame. We expect the jobs total to rebound in the next report. As Exhibit 1 shows, using a three-month moving average, nonfarm payrolls are still expanding at a decent clip, and the growth is as strong as it was in the years preceding 2020’s COVID-19 lockdowns.
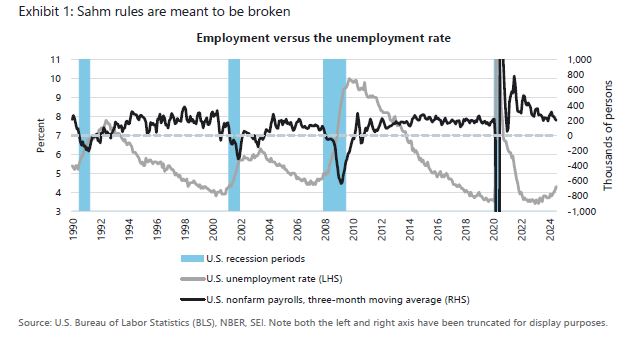
Although the unemployment rate has risen noticeably, the increase is from an exceedingly low level and reflects a big rise in the labor force as migrants join the workforce. Pessimistic economists have been citing the so-called Sahm Rule, a statistical observation that notes whenever the unemployment has risen more than one-half percentage point above its cyclical low during the previous 12 months, it has been associated with a recession and a further rise in unemployment over the following months. Claudia Sahm, the economist who popularized this correlation, recently cast doubt that the rule applies this time around. We still believe that the labor market is simply returning to normal following the extraordinary multi-year turmoil caused by COVID-19.
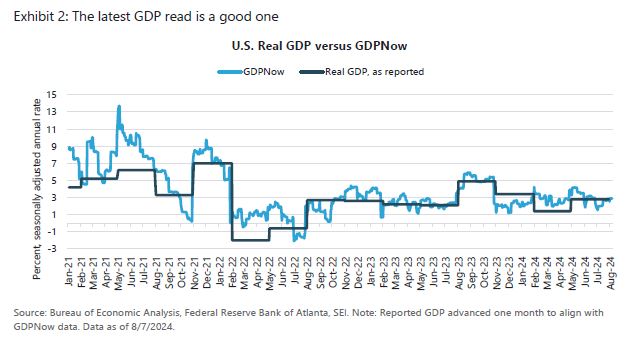
Although the data are mixed, the overall economy still seems to be expanding at a solid clip. Exhibit 2 highlights the GDPNow statistic published by the Federal Reserve Bank of Atlanta. The latest reading, dated August 5, suggests that inflation-adjusted gross domestic product (GDP) is rising at a 2.9% annual rate thus far in the current quarter. That is comparable to the actual GDP growth rate logged in the second quarter. It remains to be seen whether the economy will maintain this pace. Recall that this statistic is only a running estimate of real GDP growth based on the economic data that are available. It is not a forecast per se. Nevertheless, we think it underscores the continued resiliency of the U.S. economy, with growth running more than a percentage point above the consensus forecast.
Carried away
Most financial-market observers agree that the surge in volatility has more to do with the unwinding of leveraged bets associated with the so-called “carry trade” than anything to do with economic fundamentals. Rather than blame the economic data, it makes more sense to blame central-bank policies, financial leverage, and excessive investor optimism. The carry trade—most notably, borrowing in a country with very low interest rates and deploying those funds with leverage in the assets of higher-yielding countries—suddenly broke down after the Bank of Japan (BOJ) raised its policy rate by a mere 15 basis points (0.15%) to a level of 0.25%. By comparison, the U.S. federal-funds rate remains between 5.25% and 5.50%, although we believe a quarter-point (0.25%) cut in September is now a near-certainty.
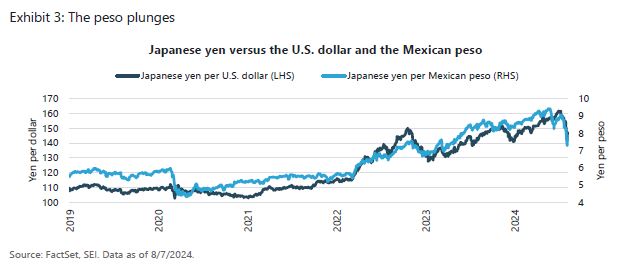
The unwinding of the carry trade has resulted in breathtaking moves in the foreign exchange market. Not only has the Japanese yen surged against the U.S. dollar, it has risen even more against countries that were the focus of the most popular carry trades, such as the Mexican peso, as illustrated in Exhibit 3. The yen appreciated more than 20% against the peso between the end of May and the first week of August, erasing more than two years of gains in the Mexican currency. If the carry trade is akin to “picking up nickels in front of a steamroller,” as it has been described, it would seem that the steamroller finally caught up.
It is difficult to determine how much more unwinding of the carry trade is needed. Exhibit 4 is a chart we have presented in previous Economic Outlook reports. It shows the net positioning of futures traders versus the yen. Traders obviously were quite short the Japanese currency as of the week ended August 2. Over the past 20 years, net positioning has been this short only three other times– July 2007, February 2014, and February 2018. During the positioning unwind that began in the summer of 2007, the yen appreciated nearly 40% against the dollar over the subsequent five years. The other two instances resulted in a stronger yen as well, although the moves were less dramatic than that of 2007.
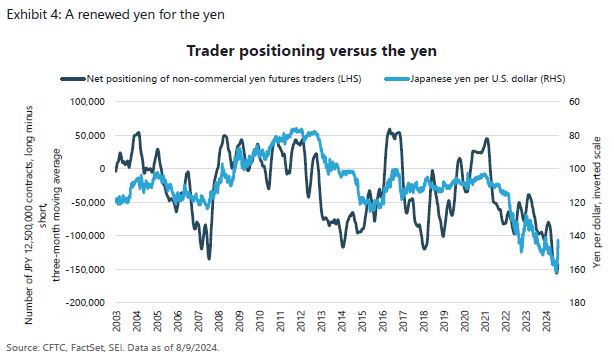
The yen’s gain in recent weeks has been a strong one, but the interest-rate differential between 2-year Japanese government bonds and 2-year U.S. Treasurys remains exceedingly large, even though the gap has narrowed from a high of 5% as of October 2023 to 3.5% currently. In an effort to stem the panic, the Deputy Governor of the Bank of Japan announced that the central bank “will not raise its policy interest rate when financial and capital markets are unstable.” Although currency traders may be hesitant to double down on this trade (we would guess they remain quite short versus the dollar), we think the sharpest moves in the yen/dollar exchange rate are behind us in view of the BOJ’s pledge.
Treasury yields fall as stocks tumble
U.S. Treasurys were a clear winner during the market’s risk-off move. As we show in Exhibit 5, however, yields have been falling and bond prices rising since April on optimism that inflation was finally on a sustainable downward path and that the Fed would soon be cutting the federal-funds rate. The decline accelerated in late July/early August as market participants fled to safe-haven investments. The 10-year Treasury note slid to a low of 3.8%, its lowest level since December 2023. The 2-year note logged an even steeper decline in yield, nearly closing the yield-curve inversion (where the 2-year yield trades higher than that of the 10-year note) which had been in place since mid-year 2022.
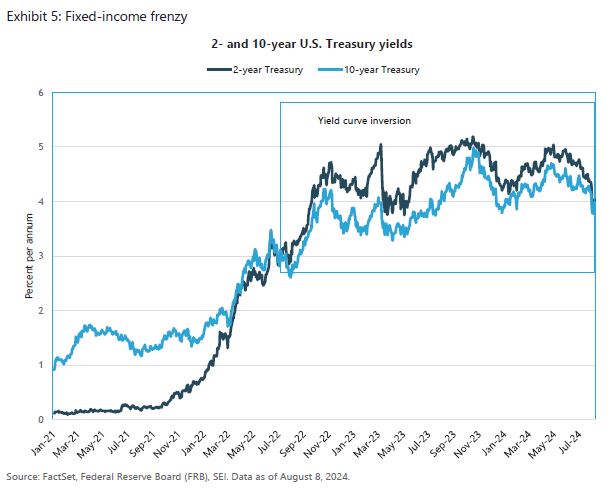
As markets settled, yields have edged higher, with the benchmark 10-year Treasury yield climbing back toward 4%. We continue to believe that interest rates should settle closer to the levels that prevailed before the onset of the Global Financial Crisis of the late-2000s, and that the 10-year Treasury note should trade sustainably in the 4%-5% range.
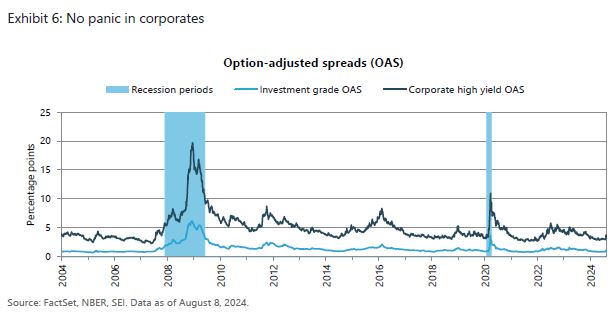
Credit spreads, highlighted in Exhibit 6, have widened for corporate high-yield bonds. But the damage seems relatively limited to date, with the deterioration consistent with other minor “growth scares” experienced in the past year or so. The most recent spread- widening certainly pales against the blowouts sustained in 2022 and earlier non-recessionary periods. Meanwhile, the increase in spreads for investment-grade corporate bonds is hardly noticeable in the chart. Investor panic in this space is effectively non-existent.
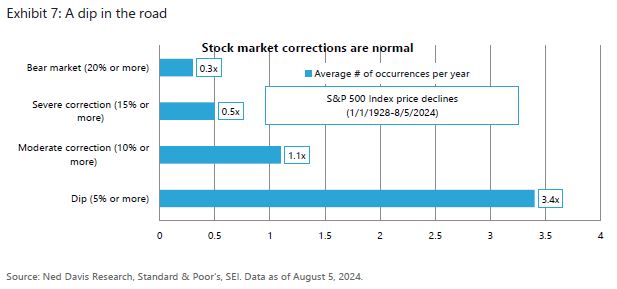
Equities, of course, were hit pretty hard. The drawdowns in Japanese stocks, the tech sector, and other momentum plays were particularly harsh. But the damage seems to be contained. Thus far, the peak-to-trough decline in the U.S. broad-market S&P 500 Index amounts to 8.5%. Exhibit 7 highlights the fact that price declines of 5% or more occur, on average, 3-4 times per year. Moderate equity drawdowns of 10%-15% usually have occurred about once a year. More severe market downturns come along about every other year. In this context, the market’s recent downturn was not unusual.
Overall, we view the relatively modest correction in risk assets more as a mid-course reset rather than the start of a more serious decline. Valuation remains a concern for U.S. large-cap equities, however. The forward price-to-earnings (P/E) ratio on the S&P 500 Index still remains above 20, although that’s down from a recent high of more than 23; the price correction and a rise in earnings estimates have both pushed the P/E ratio lower. The eight largest stocks in the S&P 500 Index have logged a P/E ratio contraction in recent weeks from a high of nearly 32 to a current reading closer to 28.
Exhibit 8 highlights the Blue Angels chart popularized by economist Ed Yardeni. The chart compares the actual price-return level of the S&P 500 Index against would-be levels of the index at different forward P/E ratios. Yardeni refers to the chart as the “Blue Angels” because the ratio lines “fly” in parallel formation like the famed U.S. Navy squadron of the same name, while the actual S&P 500 Index, depicted in the chart as the blue line with diamond markers, cuts through the “contrails” of the various forward P/E ratio levels.
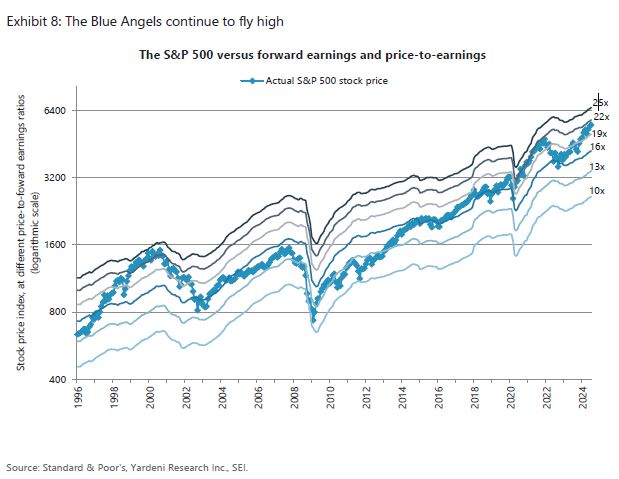
The chart not only shows how expensive equities are at any given moment relative to history, it also highlights the current trajectory of 12-month forward operating earnings projected by bottom-up security analysts. Climbing contrails point to rising earnings estimates, thereby supporting a higher stock price at a given P/E ratio. Forward-looking earnings estimates have been on the rise since the start of 2023, with analysts’ estimates for EPS growth accelerating in 2024. Forward-looking P/E ratios have jumped, too, from 16.6 at the end of December 2022 to 21.0 at the end of July 2024. The P/E ratio slightly exceeded current levels for much of 2020 and 2021, a time when earnings estimates were rising at an even faster pace than they are now. The only time in the past 28 years when earnings multiples ran even higher was during the “dot-com” bubble of 1998 to 2000.
Until earnings growth decelerates, one probably should give the U.S. stock market—and risk assets generally—the benefit of the doubt. To mitigate the exposure to the highly valued U.S. market, SEI continues to recommend broadly diversified equity exposure across size, geography, and style. While we cannot be sure that the recent correction has run its course, signs of economic resiliency in the U.S. and elsewhere, the start of a global monetary easing cycle, and strong corporate financial positioning all suggest that the bull market in risk assets still has some life left in it.
Glossary
A carry trade involves borrowing at a low interest rate and then investing in an asset with a higher interest rate.
The S&P 500 Index is a market-weighted index that tracks the performance of the 500 largest publicly traded U.S. companies and is considered representative of the broad U.S. stock market.
The option-adjusted spread (OAS) estimates the difference in yield between a security or collection of securities and a risk-free rate (typically comparable-duration Treasurys) after removing the effects of any special features, such as provisions that allow an issuer to call a security before maturity.
Gross domestic product (GDP) is the total monetary or market value of all the goods and services produced in a country during a certain period.
Price/earnings (P/E) ratio is calculated by dividing the current market price of a stock by the earnings per share. Price/earnings multiples often are used to compare companies in the same industry, or to assess the historical performance of an individual company.
Important information
This material represents an assessment of the market environment at a specific point in time and is not intended to be a forecast of future events or a guarantee of future results. All information as of the date indicated. There are risks involved with investing, including possible loss of principal. Diversification may not protect against market risk. This information should not be relied upon by the reader as research or investment advice, (unless you have otherwise separately entered into a written agreement with SEI for the provision of investment advice) nor should it be construed as a recommendation to purchase or sell a security. This information is for educational purposes only. The reader should consult with their financial professional for more information.
Statements that are not factual in nature, including opinions, projections and estimates, assume certain economic conditions and industry developments and constitute only current opinions that are subject to change without notice. Nothing herein is intended to be a forecast of future events, or a guarantee of future results.
Certain economic and market information contained herein has been obtained from published sources prepared by other parties, which in certain cases have not been updated through the date hereof. While such sources are believed to be reliable, neither SEI nor its affiliates assumes any responsibility for the accuracy or completeness of such information and such information has not been independently verified by SEI.
Index returns are for illustrative purposes only and do not represent actual investment performance. Index performance returns do not reflect any management fees, transaction costs or expenses. Indexes are unmanaged, and one cannot invest directly in an index. Past performance does not guarantee future results.
This material is not directed to any persons where (by reason of that person's nationality, residence or otherwise) the publication or availability of this material is prohibited. Persons in respect of whom such prohibitions apply must not rely on this information in any respect whatsoever.
Information in the U.S. is provided by SEI Investments Management Corporation (SIMC), a wholly owned subsidiary of SEI Investments Company (SEI). Information in Canada is provided by SEI Investments Canada Company, the Manager of the SEI Funds in Canada.


