Quarterly economic outlook: The world just keeps truckin’ on. (Long Version)
Looking back at the year thus far, a famous line from the Grateful Dead’s song “Truckin’” sums it up the best: “What a long, strange trip it’s been.” From the time he entered office on January 21, signing a flurry of executive orders, President Trump has kept up a frenetic pace pushing against the status quo on all fronts. The trip is likely to get even stranger.
The drama of 2025 will continue in the final three months of the year. The Administration will fight to maintain the tariffs it has imposed on all its trading partners. It will also battle Congress over the President’s attempt to impound funds that have been appropriated by the legislative body. There will be a fight over Trump’s attempt to fire a Federal Reserve Board governor—with a victory giving him the opportunity to fill a second vacancy at the central bank in short order. And more judicial battles await over the deportation of undocumented workers and the extent of the due process that should be given them.
Let the good times roll
As we’ve noted in previous reports, uncertainty over economic policy has been off the charts this year. Yet, the U.S. economy continues to exhibit surprising resiliency. Exhibit 1 compares the trend of inflation-adjusted gross domestic product (GDP) of the G-7 countries since 2010. Although U.S. economic growth began to pull away from the other good performers (Canada, the U.K. and Germany) around 2014-2015, it opened the gap dramatically during and after the COVID-19 pandemic. Over the past 15 years through the second quarter, the U.S. has logged a cumulative inflation-adjusted gain of 43.4%. The next best performer has been Canada (+33.6%) and the U.K. (+26.9%). Canada benefited from its close economic ties with the U.S., although this deep economic integration turned into a distinct disadvantage this year. The U.K. also has endured a slowing of growth in the post-COVID and post-Brexit period, but the country can take some solace from the fact that it has outpaced Germany, the European continent’s economic powerhouse; that country’s overall economic activity is still below its 2022 peak and the cumulative gain since 2010 is now no higher than that of France.
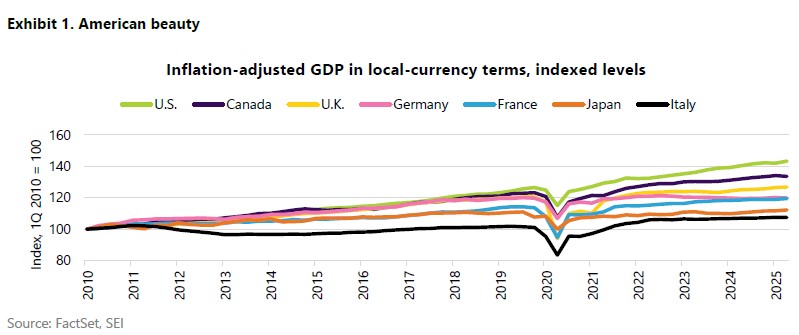
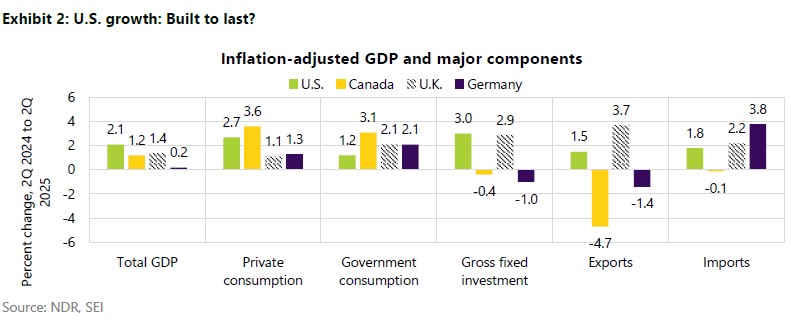
Exhibit 2 highlights the components of GDP for the U.S., Canada, the U.K. and Germany between the second quarter of 2024 and the second quarter of 2025. Growth from one quarter to the next has been volatile— especially during the first half of this year. The U.S. recorded an outright decline in real GDP during the first quarter as imports poured into the country ahead of the imposition of tariffs. By contrast, GDP grew at a 3.8% annual rate in the second quarter as imports fell sharply. Canada, the U.K. and Germany experienced an opposite pattern, registering a strong first quarter followed by a weaker second. When measured over four quarters through midyear, the U.S. is still the leader although the 2.1% gain in overall inflation-adjusted GDP is markedly slower than the increases recorded in 2023 and 2024.
The U.S. benefitted from strong growth in fixed investment as the major technology companies spent heavily on the build-out of artificial intelligence infrastructure over the four-quarter period, including the training of large language models and the expansion of data centers and semiconductor manufacturing plants. In Canada, private consumption was strong, aided by lower inflation and interest rates, various tax breaks and the removal of the consumer carbon tax effective April 1, 2025. The Trump tariffs imposed on aluminum, steel and non-USMCA-compliant autos and other goods exported to the U.S. have hurt overall growth, however. The U.K. has experienced solid growth in its exports through midyear; it helps that it faced the lowest reciprocal tariffs of any country on its exports to the U.S., only 10%. Other components of U.K. GDP continue to grow sluggishly with interest rates and inflation remaining elevated and tax increases this year hurting consumption and employment. Germany, meanwhile, remains the laggard and has barely posted any growth. Fixed investment and exports have both decreased while imports have soared, led by a surge of Chinese electric vehicles and capital goods.
Although the U.S. economy continues to chug along, there are signs that the labor market is beginning to weaken. The event that grabbed everyone’s attention was the big downward revisions in non-farm payrolls for May and June announced in early August. It certainly changed the rhetoric coming out of the Fed. Even Fed Chairman Powell, previously resistant to the pressure to lower the federal funds rate, struck a more dovish tone in his remarks at the Jackson Hole monetary policy conference in late August. Excluding the Covid lockdown period, the three-month change over the June-to August period in nonfarm payrolls has increased at its slowest pace since 2012—a gain of just 29,000 persons per month. The U.S. headline unemployment rate, meanwhile, inched higher to 4.3% in August. Even though that figure is still historically low, it is up almost a full percentage point from the post-COVID bottom of 3.4% recorded in April 2023 and is the highest reading since October 2021.
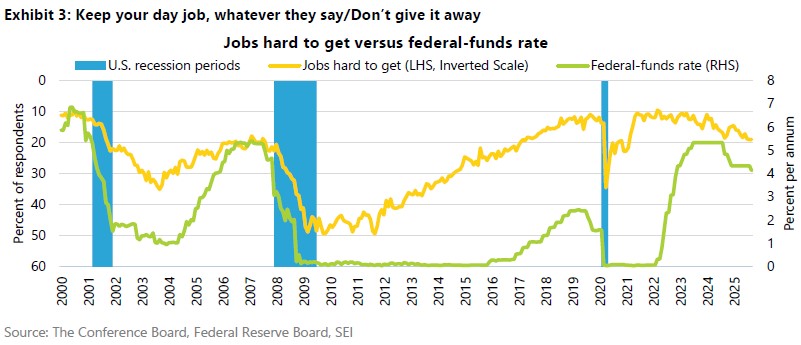
Respondents to the Conference Board’s monthly consumer survey say that jobs are increasingly hard to get. As we show in Exhibit 3, this statistic has been worsening noticeably since 2023 from a very positive level following the labor shortages that arose during the recovery from COVID. We chart this measure on an inverted scale to highlight the correlation with the federal funds rate. In previous cycles, the Fed has been quick to cut the funds rate amid the first signs of weakening in the job market. In 2019, the central bank instituted a series of rate cuts even though jobs were still easy to get. Inflation concerns have led to a different response during the current cycle. The Fed’s last rate hike came in August 2023 just as signs started to crop up that the labor market was finally beginning to soften ever so slightly. The U.S. central bank’s policy rate held at that peak level for an unusually long time, until September 2024. The “jobs-hard-to-get” measure took a brief but sharp spike at that time, and the Fed responded with a half-point cut in the federal funds rate. The timing was unfortunate: The cut coincided with the final 1-1/2 months of the U.S. presidential campaign. It prompted intense criticism from the Trump campaign that the Fed was playing politics. Bond investors also reacted negatively, sending the yield on the 10-year Treasury bond soaring from a low of 3.69% on September 19, 2024—the day of the FOMC decision—to a high of 4.8% in mid-January.
The economic backdrop now seems very different. Concerns are rising that employment conditions will continue to worsen. Layoff announcements ticked up in August; they are the highest they've been both year-to-date and since 2020. While Federal government positions eliminated by the Department of Government Efficiency account for roughly one-third of those cuts, an increasing number of companies in the private sector are citing economic and market conditions as a negative factor. At least until the last month or so, the economy was best characterized as being in a low hiring, low firing mode. Hiring is still low, but the firing seems to be on the rise. No wonder workers are fretting about their jobs.
The news isn’t all bad, however. The slowdown in employment growth reflects temporary factors that could reverse, not just longer-lasting ones. The imposition of tariffs and the upending of long-established supply-chain and trading relationships have probably caused businesses to take a more cautious hiring approach this year. Government employment and spending cuts, along with major policy reversals from the priorities of the Biden Administration, have also had an impact. The U.S. economy, however, is flexible. Businesses will adjust. Fiscal policy should become more stimulative in 2026 as new tax breaks come into effect. The deregulation of various industries also will create new opportunities for growth. The tariff picture is expected to stabilize once the Supreme Court rules on the constitutionality of the reciprocal tariffs.
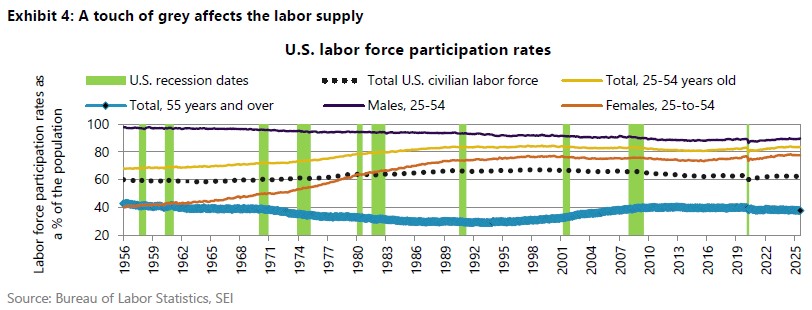
The more persistent factors limiting employment growth include the crackdown on immigration and the country’s aging demographic profile. As we noted all year long, migrant encounters at the southern border have slowed to a trickle and the government’s deportation efforts have been ratcheted up substantially. This comes at a time when more than 11,000 people are turning 65 each day and over 15,000 are starting to receive retirement benefits. Exhibit 4 tracks the U.S. labor force participation rate by age cohort. The prime-age category (25-to-54 years of age) remains mostly steady at a high level. But as the Administration ramps up deportations, the number of prime-age participants may start to decline. The participation rate of those 55 and over, meanwhile, dropped after COVID and it continues to edge lower. That cohort is large enough to depress the overall rate. Note as well that the labor force drop-out rate increases rapidly as people age; the participation rate for those 65 and over is less than 20% versus 38% for the 55 and over cohort. Even if employment grows rather slowly in the months ahead, the impact on the headline unemployment rate should be rather small because the labor-force growth is slowing to a crawl.
While the labor market struggles to grow, there are other measures of economic activity that point to resiliency. The Federal Reserve Bank of Atlanta’s running tally of real GDP, based on the latest data released thus far for the quarter, shows third-quarter GDP is on track for an out-sized 3.9% percent quarter-to-quarter annualized rate of gain. This measure will change as more datapoints are released, but thus far only residential investment is a detractor.
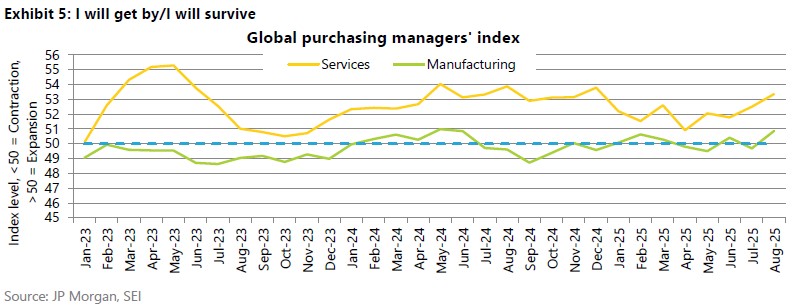
Purchasing manager surveys of economic performance are also robust, not just for the U.S. but for other countries too. Exhibit 5 tracks the purchasing manager surveys for both services and manufacturing industries on a global basis. Among the major developed countries, the U.S. still leads the pack, with a combined services and manufacturing reading of 54.6% as of August, The U.K. reached 53.5% in August thanks to a vibrant services sector, while Germany and the eurozone are just north of 50 (the demarcation line that separates contraction from expansion). Canada is a laggard at 48.4%, ranking next to last among the 30 developed and emerging countries tracked by S&P Global. Although purchasing managers in manufacturing industries reported better numbers in August, the U.K., Canada, Japan and Germany are still seeing more industries contracting than expanding.
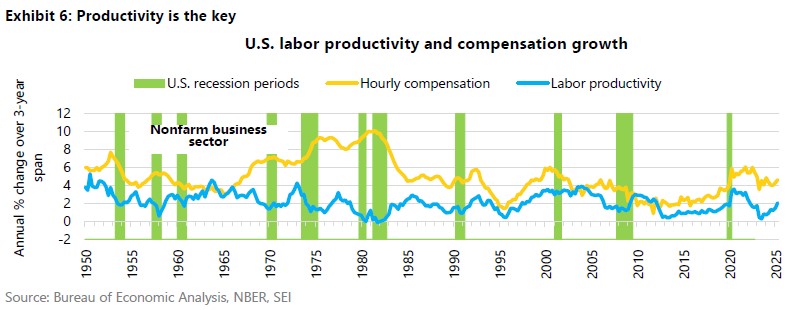
We think a structurally tighter U.S. labor market will lead to a structurally higher rate of compensation growth, especially compared against the very tepid gains in the aftermath of the Global Financial Crisis. Unless offset by productivity growth, inflation is expected to stay well above the Fed’s 2% long-term target. Exhibit 6 shows worker compensation and productivity growth since 1950. We measure both series over a three-year period at an annual rate to get a better sense of the underlying trend. Worker compensation has been holding above a 4% rate since COVID.
As of the second quarter, the three-year average amounted to 4.6%. This growth rate has been running at the higher end of the range that has been in place since 1990. Meanwhile productivity has rebounded 2.1%.
Those with a more optimistic outlook on economic growth and inflation assume that productivity growth will accelerate sharply in the years ahead. It surely is an argument that deserves respect, especially at a time when technologies such as generative artificial intelligence, quantum computing and blockchain implementation hold such promising possibilities, much like the build-out of the internet did 25 years ago. Productivity growth exceeded 3% for several years in the late-1990s and early-2000s; a repeat of that experience is possible if the huge spending currently being poured into these areas leads to an accelerated adoption rate across the economy. Of course, this remains to be seen. A recent report published by researchers at the Massachusetts Institute of Technology (MIT)1 suggests that 95% of generative AI projects currently fail to deliver measurable returns. Additionally, only 5.4% of companies are fully deploying AI capabilities across their operations. These are early days, but the speed at which these new technologies are diffused throughout the economy and how quickly they can be profitably implemented will determine the trajectory of economic growth, inflation and equity market performance in the months and years ahead.
Tariffs are here to stay
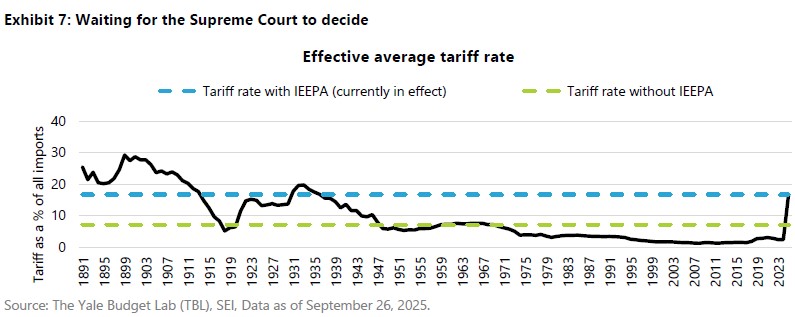
The uncertainty over tariffs isn’t quite over. The Supreme Court needs to decide whether to uphold the ruling of both the U.S. Court of Appeals for the Federal Circuit and the U.S. Court of International Trade that the tariffs imposed under the International Emergency Economic Powers Act (IEEPA) are unconstitutional. If it does so, it will nullify about 70% of the tariffs President Trump has put in place. In the meantime, the custom duties are still in effect. The Supreme Court will take up the case right away, which could lead to a decision before the end of the year. Exhibit 7 underscores the dramatic change in tariff rates that could result from the end of the IEEPA tariffs, as calculated by the Yale Budget Lab. The current effective tariff rate is north of 16%, the highest level since 1935 and a huge jump from last year’s 2.4% rate. Without the IEEPA tariffs, the effective rate falls to 7%.
If the IEEPA tariffs are judged to be unconstitutional, it is sure to create some disruption for markets and business activity. But it shouldn’t be as unnerving as the impact from Liberation Day, April 2, when President Trump first unveiled his reciprocal tariffs to the public. The countries worst hit by the tariffs – India, Brazil, Switzerland – will get a major reprieve. Canada, Mexico and China should also benefit from the ending of the 20% fentanyl-trafficking tariffs. All exporting countries to the U.S. will cheer to a lesser or greater extent. Multinational companies and domestic businesses heavily dependent on foreign-made parts in their manufacturing processes would enjoy a major windfall. It would cut the cost of inputs that go into the production process and put downward pressure on goods inflation. Exporters to the U.S. would see an improvement in their competitiveness and profit margins. China, Canada and Mexico would be big winners because their share of U.S. imports is so large, but the rest of the world would enjoy more than two-fifths of the tariff decline.
There is one interesting thing worth noting pertaining to Canada. Official data on U.S.-Mexico-Canada Agreement (USMCA) compliance appears to be underestimating the tariff exemptions being given to Canadian firms. As of June, roughly 90% of Canadian goods entered the U.S. duty free this year, even though only 56% of those imports were officially USMAC compliant. This brings the estimated average effective tariff rate on Canada to 6.2%, down from the headline rate of 35%. If this trend persists, the outlook for the Canadian economy should brighten into year-end.
The bad news is that tariff relief may prove fleeting. In last quarter’s economic outlook report we noted that the Administration has other tools at its disposal to reimpose tariffs near the overall levels that are currently in place. Section 232 of the Trade Expansion Act of 1962, for example, has been used heavily this year and will likely be the Administration’s preferred option. It enables the President to impose tariffs if the Secretary of Commerce finds that imports threaten national security following a thorough investigation. This power has been used this year to impose tariffs on steel and steel derivatives, aluminum and aluminum derivatives, automobiles and auto parts, copper, branded pharmaceuticals, semiconductors, furniture, lumber and heavy trucks. Investigations are currently underway to impose additional 232 tariffs on critical minerals, commercial aircraft and jet engines, polysilicon and derivatives and unmanned aircraft systems.
President Trump can also invoke Section 301 of the Trade Act of 1974. The law allows the U.S. Trade Representative, under the direction of the President, to counteract unfair trade practices if the agency makes an affirmative determination in an investigation. This power was used against China during Trump’s first term to impose tariffs on solar cells, semiconductors and medical supplies. There is a broad list of Chinese imports still subject to Section 301 duties, including electronics and semiconductors, electric vehicles and lithium batteries to name a few.
If the Administration wants to keep across-the-board tariffs in place, the President can use Section 122 of the Trade Act of 1974. This law is used specifically to deal with a balance of payments issue or excessive dollar depreciation. A maximum import surcharge of 15% can be imposed for up to 150 days. Congress would need to approve any extension to the timeline, which limits its effectiveness in Trump’s view. But it would give the Administration time to conduct thorough investigations into a wide array of industries and products under the previously mentioned trade powers. There are other trade powers that the President can use. The most controversial one would be Section 338 of the Tariff Act of 1930—part of the legislation known as the Smoot-Hawley Tariff Act. It’s a power that has never been used by a President, but it gives the Executive the ability to impose additional tariffs of up to 50% on countries that discriminate against U.S. commerce.
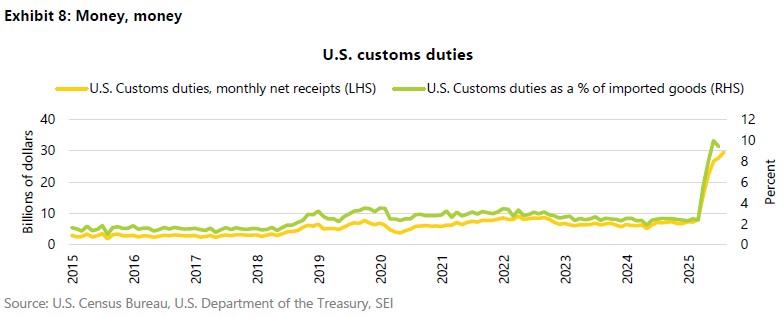
While it isn’t completely clear what path the Administration will take, we have little doubt that tariffs will remain a major policy tool. At the very least, it has become an important revenue source for the government. As we highlight in Exhibit 8, customs duties have soared since April, with net receipts in the month of August reaching $29.5 billion. That amounts to about 10% of the value of goods imported. Since the effective tariff rate based on current policy is substantially higher, the revenue stream should increase even further. We figure the tariffs collected could eventually exceed 1% of GDP.
A Supreme Court ruling against the reciprocal taxes would temporarily blow a big hole in the Administration’s budget calculations. As of June, the Federal deficit amounted to 6.25% of GDP versus a high in February of 7.2%. A ruling that overturns the tariffs would end that revenue stream, at least until they are reimposed under other sections of the trade laws. Through August, that total amounts to nearly $60 billion.
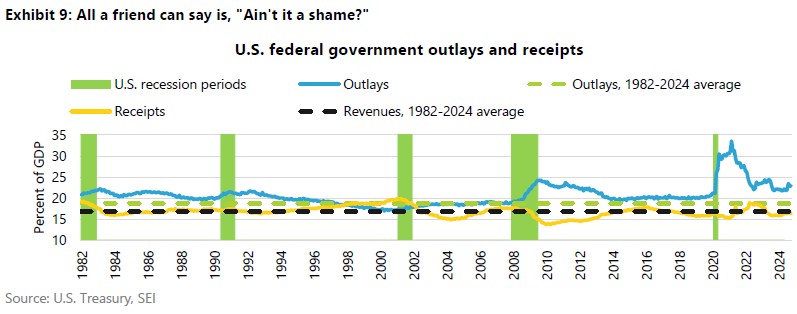
As shown in Exhibit 9, the Federal Government’s finances have been in chronic deficit for decades. The only exception in recent memory was the 1998-2001 period when a combination of spending restraint, a booming economy and a cascade of capital gains tax realizations courtesy of the tech bubble created a fiscal surplus. Spending continues to hold above 23% of GDP versus its long-term average of 18.7%. Revenues, meanwhile, have managed to stay close to the long-term average of 16.8%, although this level of receipts comes at a time when the economy is in the midst of a long expansion. If a recession were to materialize, revenues would almost surely decline as a proportion of GDP while anticyclical spending programs would kick in. A deficit approaching 10% of GDP is not out of the question in a recession of moderate severity.
Troubles ahead, troubles behind for the Fed
We would be hard-pressed to name one elected official anywhere who would rather have higher interest rates than lower ones. Donald Trump has been especially vociferous in expressing his preference. He has badgered Fed Chairman Powell the whole year. Now he is seeking to fire Lisa Cook, a Biden appointee whose term doesn’t expire until 2038. The Supreme Court will decide whether he has that power, and whether the alleged mortgage fraud of which Governor Cook is accused represents sufficient grounds for dismissal. The fight understandably has many observers concerned about the Fed’s independence. We are more optimistic, however, than the consensus view and believe that the central bank’s independence will remain intact.
First, even if President Trump succeeds in his attempt to install a majority of appointees to the Board of Governors, that hardly means that they will be amenable to overt political pressure. Jerome Powell was appointed to the Chairmanship by President Trump during his first term and no one will accuse him of doing the President’s bidding. Note that, at the September meeting of the Federal Open Market Committee, both Governors Waller and Bowman—Trump appointees during his first term—voted with the majority for a one-quarter point policy-rate reduction instead of the half-point reduction desired by Stephen Miran, who was approved by the Senate just before the meeting. In addition, all appointees to the Board need to be approved by the Senate. During Trump’s first term, five nominees to the Board of Governors were rejected because they were deemed too controversial. Miran’s appointment might suggest that the Senate has become more pliable to Trump’s demands, but we would like to believe the vetting process would have been more stringent if he were up for a longer term or the Chairmanship position. Finally, there are the regional Fed presidents to consider. The idea that a majority of the seven Fed governors based in DC will block the five regional Fed presidents whose terms are up for renewal next February at the command of the President is a stretch. Besides, only two of those Fed presidents are rotating into voting positions next year. This means that Trump-backed members will total half of the vote, not a majority, even if all the other unlikely steps toward packing the Fed prove successful.
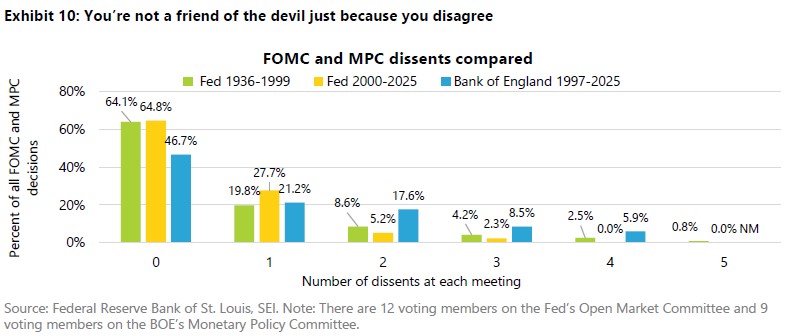
Beyond the obvious problems raised by the effort to curb the Fed’s independence, would it be such a bad thing if there were more diversity of thought inside the Federal Reserve? It certainly would have helped in 2021, when there was still a lot of resistance to raising the federal-funds rate even though it was evident that inflation was beginning to run out of control. Exhibit 10 examines the voting patterns of the FOMC members over the past 25 years versus earlier decades going back to the creation of the group in 1936. It also compares the frequency of dissents against those from the Bank of England’s Monetary Policy Committee (MPC) since that group’s formation in 1997, when the BOE became independent. Nearly two-thirds of the FOMC’s decisions on interest rates have been unanimous since 2000, not too different from what had been recorded between 1936 and 1999. But dissents by two or more members tended to be more frequent before 2000. The comparison with the MPC members at the BOE is even starker. Since 1997, unanimous decisions have occurred only 47% of the time. Dissents by two or more of the nine MPC participants are more frequent than at the Fed on a regular basis.
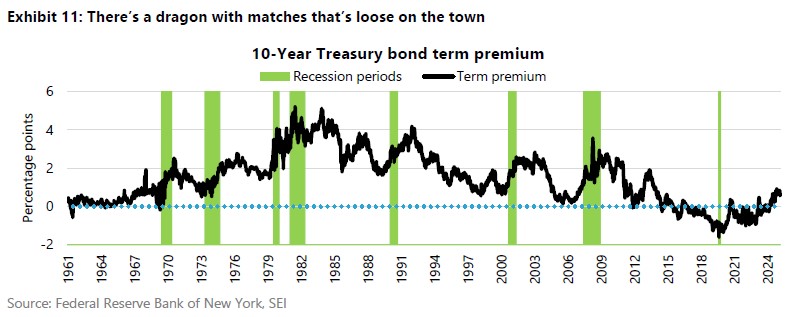
We view Trump’s gambit to force the Fed to dramatically lower its policy rate by co-opting the FOMC as a grey swan. The probability that he will achieve that goal is low, but the consequences are high if he manages to do it. The market response would be hard to predict. It could lead to a stock-market melt-up as the Fed pours more liquidity into an economy that is already doing well. Gold prices might also soar while bond prices and the dollar fall dramatically if investors view this heavy-handed intervention as a step toward monetizing the debt. The experience of the 1970s would become more relevant. We may not endure a return of double-digit inflation, but the term premium on bonds would likely rise to levels that haven’t been seen at least since the 1980s and 1990s. Exhibit 11 highlights the fact that the term premium on the 10-year Treasury bond has been increasing over the past two years. Our base case scenario is that it will rise further into the 1%-to-1.5% range, implying a nominal 10-year bond yield perhaps trading mostly in the 4.5%-to-4.75% range in the next year or so. If Trump has his way, a term premium of 2% to 3% becomes a possibility. In the short run, a Supreme Court decision that allows the President to fire Lisa Cook probably would elicit a response along these lines. It would not be the end of the story, of course, and any reaction could prove ephemeral. But any move down this slippery slope would be problematic to say the least.
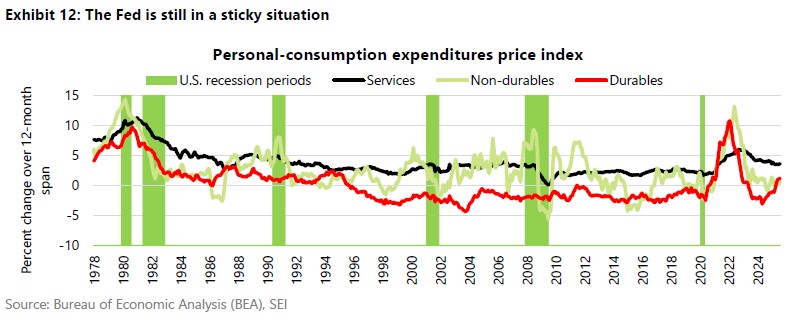
Softening labor-market conditions provided the rationale for the one-quarter point reduction in the Federal-funds rate in September. The inflation outlook provides less support. Core inflation, as measured by the year-over-year personal-consumption expenditures (PCE) price index, has moved back up toward 3%, well above the Fed’s 2% target. Exhibit 12 shows that services inflation remains quite elevated, with prices rising 3.6% over the 12 months ended August. This pace is more in line with the trend recorded during the 1990s and the first decade of the 2000s than it is with the experience in the years following the Global Financial Crisis. Note that durable goods prices are on the rise again. Tariffs, the dollar’s decline and the movement of supply chains away from China may finally be showing up in the data. The resulting price increase, 1.2% over the past year, is still modest. But compared to the long deflation in durable goods prices starting in 1995 and lasting until the COVID-related supply-chain snafus, we consider this change in trend to be noteworthy. Nondurable goods inflation, driven mainly by food and energy, remains subdued for the moment.
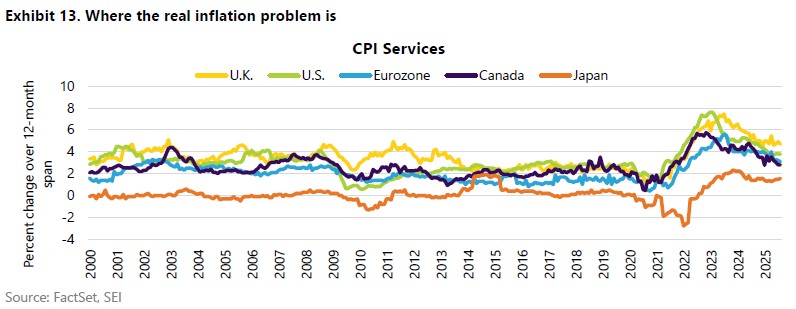
Services inflation continues to be a problem for all the major economies since the recovery from the 2020 pandemic. For most economies, services are a much larger portion of households’ consumption basket than goods. Unfortunately, productivity improvements in services have been hard to come by (or at least much harder to measure accurately). As Exhibit 13 highlights, inflation in services tends to be sticky. The U.K. continues to record the highest inflation rate in services among the countries tracked in the chart, running 4.7% over the 12 months ended August. That country also has the highest wage growth. Other countries, including the U.S., have logged improvement. U.S. services inflation, however, has been hovering around 3.8%, throughout 2025. The weaker economies of Canada and the eurozone have recorded further deceleration, justifying the easier monetary policies those countries have pursued.
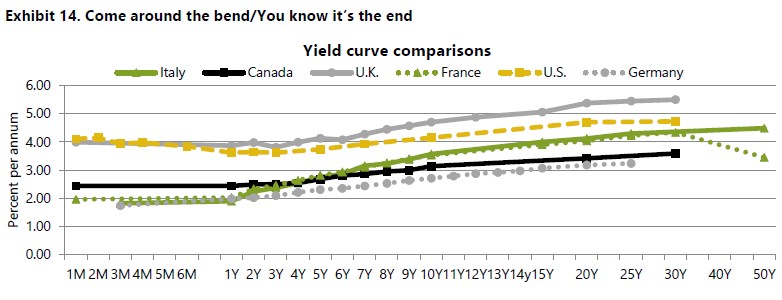
Although short-term interest rates have fallen significantly among most developed countries over the past 12 months (Japan is the major exception), bond yields have gone in the opposite direction. The increase in yields is especially pronounced the further one goes out on the curve. As shown in Exhibit 14, the U.K.’s sovereign bond yields are high across the entire curve, followed by the U.S., Italy, and France. The configuration of the curves, and their levels, roughly correlate with the current inflation backdrop, future inflation, growth expectations, and investor concerns regarding the fiscal outlook.
Although growth and inflation expectations vary, long-term fiscal stability is an issue of concern in all these countries, Germany possibly excepted. Politicians in the U.S. and France have opted to ignore the problem, unwilling to make tough choices on taxes and spending. The U.K. has tried to tax its way out of its fiscal difficulties, but that country seems to be on the wrong side of the “Laffer Curve,”—tax revenue increases with higher tax rates, but only to a certain point, after which tax receipts actually decrease. The damage done to government fiscal positions by the Global Financial Crisis of 2008-2009 and by the COVID lockdowns have not been fully repaired. The aging of populations is an overwhelming tide facing most developed countries leading to a structural rise in spending on pensions and healthcare. More recently, governments have been forced to increase their military budgets to counter the potential threat posed by China and Russia. And then there is the sharp shift upwards in interest rates which, when combined with increasing debt, have dramatically increased net interest expense. According to the Organisation for Economic Co-operation and Development, debt service costs for its 38 member countries rose to 3.3% of GDP in 2024. That was higher than the proportion collectively spent on defense. A further steepening of countries’ yield curves seems likely as central banks cut their policy rates, but longer-term yields remain elevated as governments maintain a high level of debt issuance.
High Time
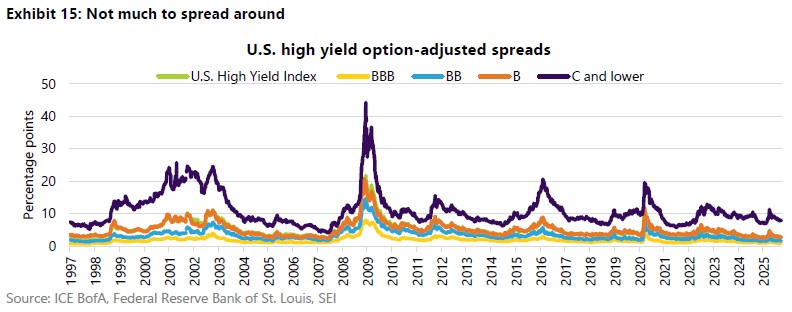
It looks as if investors have no fear. In the fixed-income markets, high-yield credit spreads remain tight, as we highlight in Exhibit 15. Even the riskiest bonds, rated C and lower, sport an option-adjusted spread versus Treasurys that is well below previous peaks and has been tighter less than 30% of the time since 1997. The less risky tranches (BBB, BB and B) have spreads that have been tighter only about 3% of the time. Companies that are more leveraged and more exposed to interest rates have nonetheless been able to refinance themselves and extend debt maturities without too much problem. Investor expectations that the Fed has embarked on an extended easing cycle serve to increase complacency.
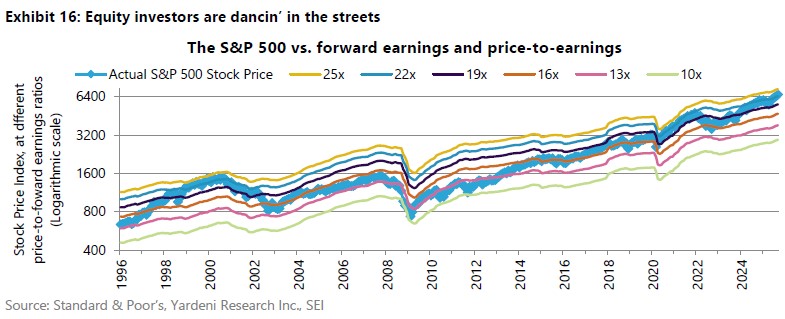
Equity markets, meanwhile, have been on a tear since bottoming out on April 9. Although the big technology stocks have led the way, smaller-cap and international stocks have participated in the run-up to a lesser extent. Exhibit 16 presents the now-familiar “Blue Angels” chart conceived by economist Ed Yardeni. It compares the actual price-return level of the S&P 500 price index against would-be levels of the index at different forward price-to-earnings (P/E) ratios. Yardeni refers to the chart as the “Blue Angels” because the ratio lines “fly” in parallel formation like the famed U.S. Navy squadron of the same name, while the actual S&P 500 index (depicted here as the blue line with the diamond markers) cuts through the “contrails” of the various forward P/E ratio levels. The chart not only shows how expensive equities are at any given moment relative to history, but it also highlights the current trajectory of 12-month forward operating earnings projected by bottom-up security analysts. Climbing contrails point to rising earnings estimates, thereby supporting a higher stock price at a given P/E ratio.
Note that the contrail lines have recently inflected upward, implying an acceleration in estimated year-ahead earnings growth. Second-quarter earnings were surprisingly strong, with 82% of companies beating expectations. This performance led analysts to revise their forecasts sharply higher. Since the end of April, forward earnings per share estimates have climbed 6.2%. The S&P 500 stock price, meanwhile, jumped 20.1%. A re-rating upward in the price-to-earnings (PE) ratio to 22.7 times has provided an even greater boost to the S&P 500 than the jump in earnings. This PE level is even higher than the level reached at the end of 2020, when equity prices were recovering at a much faster clip than earnings from the COVID-related lockdowns. This valuation metric is also closing in on the highs recorded during the 1999-to-2000 tech bubble.
Although the bull market has broadened out, the main drivers are still the mega-cap technology stocks that are perceived to be the early beneficiaries of the artificial intelligence boom. Market concentration has taken another leap upward since April, with the top ten stocks accounting for more than 37% of the S&P 500’s total capitalization. That is a new all-time high. By comparison, the ten largest stocks in the S&P 500 accounted for 27% at the height of the tech bubble in March 2000 and 34% in the heyday of Nifty-Fifty craze in 1973. Granted, today’s mega-cap companies are still putting up terrific results. According to Empirical Research Partners, the top 100 stocks generate free cash flow margins and returns on equity that are eight-to-ten percentage points higher than the rest of their large-cap U.S. and international peers—although free cash flow has declined this year for the biggest companies that are on the front lines of the capital-spending battle aimed at achieving artificial intelligence dominance (Alphabet, Amazon, Meta and Microsoft).
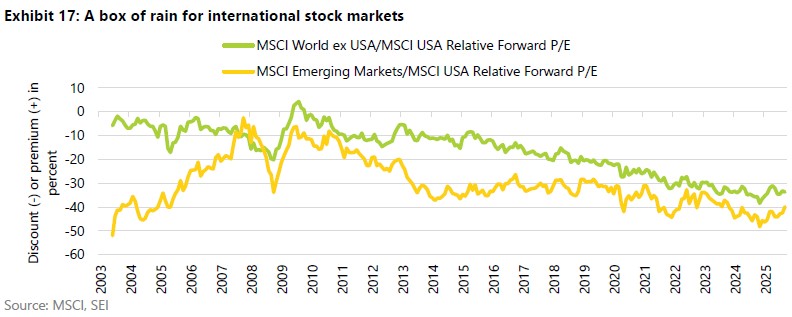
Internationally, equity investors have “rediscovered” stock markets beyond the S&P 500 this year. Through September, the MSCI U.S. total return index and the MSCI World ex-USA Index (total return) has provided almost identical returns of 15% in U.S. dollar terms. Unhedged dollar-based investors in the MSCI World ex-USA Index have enjoyed a 26% gain owing to the dollars 11% depreciation. Yet, as we show in Exhibit 17, stock-market valuations outside the U.S. remain extremely depressed. Even after a bounce from the lows recorded in November 2024, developed-country stock markets trade at a 33.7% discount to the U.S. on a relative-PE basis. Emerging markets remain even more depressed, trading at a 39.8% discount. These valuation discounts versus U.S. equities have been getting wider since 2009. Many investors have difficulty believing the downward slide will ever come to an end. Still, U.S. markets are priced for perfection while the rest of the world has lots of room for upside surprises. Don’t leave international equities or other areas beyond the S&P 500’s market leaders for dead—they deserve a place in a well-diversified portfolio.
A summary of our views:
- President Trump continues to push policy changes aggressively across many fronts, including tariffs, immigration and personnel changes at the Federal Reserve.
- The U.S. economy remains resilient despite all the policy uncertainty, although there are recent signs of deterioration in the labor market.
- Canada’s growth is supported by consumer spending but hurt by U.S. tariffs.
- Growth in the U.K. and Europe remains sluggish.
- Accelerated productivity growth is the key to a more optimistic inflation outlook, but it will take time for new technologies to have a measurable impact.
- The Supreme Court will decide on the constitutionality of the reciprocal tariffs imposed by Trump, but even if those duties are negated, there are other tools at the President’s disposal to maintain tariffs at a high level.
- Tariffs have become a significant revenue source for the U.S. government and if that flow is disrupted, the government’s deficit will widen, and financial markets could become more volatile for a time.
- The Administration is challenging the Fed’s independence, but it is unlikely the President will succeed in the attempt.
- Core inflation remains almost a percentage point above the Fed’s target and services inflation is a persistent problem across developed economies.
- Long-term bond yields are likely to remain elevated, especially in the U.S. and the U.K. reflecting inflation and fiscal-policy concerns.
- Investors remain surprisingly complacent, with high-yield credit spreads extremely tight.
- U.S. and international equity markets are in new-high territory.
- Mega-cap U.S. tech stocks are once again leading equity markets higher, although valuations and index over-concentration are yellow flags.
- International equities remain cheaper compared to U.S. stocks and offer potential upside for diversified portfolio.
Glossary
The 10-Year Treasury yield represents the annual interest rate that the U.S. government pays on 10-year Treasury notes, serving as a key benchmark for other interest rates and a barometer of investor sentiment about the economy.
G-7 Countries (also known as the Group of Seven) is an informal forum for the leaders of Canada, France, Germany, Italy, Japan, the U.K., and the U.S. to discuss and coordinate solutions for major global issues, including economics, security, and climate change.
Gross domestic product (GDP) is the total monetary or market value of all the goods and services produced in a country during a certain period.
The Organisation for Economic Co-operation and Development (OECD) is an international organization with 38 member countries that works to promote economic growth, prosperity, and sustainable development.
Federal Open Market Committee (FOMC) is the principal monetary policymaking body of the Federal Reserve System. It consists of 12 members, including the seven members of the Federal Reserve's Board of Governors and five of the twelve Federal Reserve Bank presidents, and is responsible for directing the nation's open market operations and setting interest rates to achieve the goals of maximum employment and stable prices.
Forward price-to-earnings (P/E) ratio is a stock's current price divided by its estimated future earnings per share (EPS) for the next 12 months or fiscal year. It serves as a valuation metric to assess a stock's future potential, helping investors determine if its current price is too high or low relative to anticipated earnings.
Option-adjusted spreads estimates the difference in yield between a security or collection of securities and comparable-duration Treasurys after removing the effects of any special features, such as provisions that allow an issuer to call a security before maturity. (Duration is a measure of a security’s price-sensitivity to changes in interest rates.)
A reciprocal tariff is a tax or trade restriction that one country imposes on another in response to similar actions taken by that country, aiming to create balance in trade by mirroring the tariffs or trade barriers imposed by the other nation.
U.S. Treasury bonds are debt obligations backed by the U.S. Treasury Department with a maturity between 10 and 30 years.
Yield curve represents differences in yields across a range of maturities of bonds of the same issuer or credit rating. A steeper yield curve represents a greater difference between the yields. A flatter curve indicates that the yields are closer together.
Index definitions
The Personal Consumption Expenditures (PCE) Price Index measures the prices that consumers pay for goods and services–excluding volatile food and energy prices–to reveal underlying inflation trends.
The MSCI USA Index tracks the performance of the large- and mid-cap segments of the U.S. equity market. The index’s 624 constituents comprise approximately 85% of the free float-adjusted (i.e., including only shares that are available for public trading) market capitalization in the U.S.
The MSCI World ex-USA Index tracks the performance of the large- and mid-cap segments of equity markets across 22 of 23 developed- market countries--excluding the U.S. The index’s 887 constituents comprise approximately 85% of the free float-adjusted (i.e., including only shares that are available for public trading) market capitalization in each country.
The S&P 500 Index is a market-weighted index that tracks the performance of the 500 largest publicly traded U.S. companies and is considered representative of the broad U.S. stock market.
The ICE BofA U.S. High Yield Index is an unmanaged index that tracks the performance of U.S. dollar-denominated, below- investment-grade (rated BB+ or lower by S&P Global Ratings and Fitch Ratings or Ba1 or lower by Moody’s Investors Service) corporate debt publicly issued in the U.S. domestic market.
Important information
This material represents an assessment of the market environment at a specific point in time and is not intended to be a forecast of future events or a guarantee of future results. Positioning and holdings are subject to change. All information as of the date indicated. There are risks involved with investing, including possible loss of principal. This information should not be relied upon by the reader as research or investment advice, (unless you have otherwise separately entered into a written agreement with SEI for the provision of investment advice) nor should it be construed as a recommendation to purchase or sell a security. The reader should consult with their financial professional for more information.
Statements that are not factual in nature, including opinions, projections and estimates, assume certain economic conditions and industry developments and constitute only current opinions that are subject to change without notice. Nothing herein is intended to be a forecast of future events, or a guarantee of future results.
Certain economic and market information contained herein has been obtained from published sources prepared by other parties, which in certain cases have not been updated through the date hereof. While such sources are believed to be reliable, neither SEI nor its affiliates assumes any responsibility for the accuracy or completeness of such information and such information has not been independently verified by SEI.
There are risks involved with investing, including loss of principal. The value of an investment and any income from it can go down as well as up. Investors may get back less than the original amount invested. Returns may increase or decrease as a result of currency fluctuations. Past performance is not a reliable indicator of future results. Investment may not be suitable for everyone. Diversification may not protect against market risk.
Index returns are for illustrative purposes only and do not represent actual investment performance. Index performance returns do not reflect any management fees, transaction costs or expenses. Indexes are unmanaged, and one cannot invest directly in an index. Past performance does not guarantee future results.
This material is not directed to any persons where (by reason of that person's nationality, residence or otherwise) the publication or availability of this material is prohibited. Persons in respect of whom such prohibitions apply must not rely on this information in any respect whatsoever.
The information contained herein is for general and educational information purposes only and is not intended to constitute legal, tax, accounting, securities, research or investment advice regarding the strategies or any security in particular, nor an opinion regarding the appropriateness of any investment. This information should not be construed as a recommendation to purchase or sell a security, derivative or futures contract. You should not act or rely on the information contained herein without obtaining specific legal, tax, accounting and investment advice from an investment professional.
The views contained herein are not to be taken as advice or a recommendation to buy or sell any investment in any jurisdiction. Our outlook contains forward-looking statements that are judgments based upon our current assumptions, beliefs, and expectations. If any of the factors underlying our current assumptions, beliefs or expectations change, our statements as to potential future events or outcomes may be incorrect. We undertake no obligation to update our forward-looking statements.
Information in the U.S. is provided by SEI Investments Management Corporation (SIMC), a wholly owned subsidiary of SEI Investments Company (SEI).
Information in Canada is provided by SEI Investments Canada Company, a wholly owned subsidiary of SEI Investments Company (SEI), and the Manager of the SEI Funds in Canada.


