SEI—A Global Pioneer in Managed-Volatility Investing
Managed-volatility approaches to investing, which are based on a long history of empirical evidence, offer investors a compelling way to pursue stock-market-like returns with less volatility. We launched our implementation of this investment style in the U.S. more than 15 years ago in 2004, and have since continued to innovate as managed volatility has evolved.
Brief history of an anomaly
The foundations of modern portfolio theory were first laid in the 1950s and 1960s. One of the core ideas in those early days was that the expected return on an investment should be commensurate with its risk, typically measured in terms of volatility. The idea was intuitive and straightforward: Investors should demand a greater return for holding an asset that has a more volatile (less predictable) pattern of returns.
However, in the ensuing decades, this assumption was subjected to intense scrutiny. Analysis of real-world market data found that investors generally appeared to systematically overpay for higher-volatility securities and underpay for lower-volatility ones. Said another way, returns on high-volatility stocks were notably lower than prevailing finance theories predicted, while returns on low-volatility stocks were unexpectedly higher. This was a significant and surprising finding—seemingly an anomaly, in financial parlance—that has been confirmed by subsequent studies using data from other time periods and other markets as actually being quite typical. At SEI, we also saw a compelling upshot: An investor might be able to earn better-than-expected returns for a given level of risk.
SEI’s innovative, pioneering approach
As empirical evidence of this so-called anomaly continued to accumulate, the potential investment opportunity became apparent. In our view at SEI, by investing in a portfolio of lower-volatility stocks and avoiding those that are higher volatility, a portfolio manager should be able to improve the balance between risk and return. We seized upon this opportunity by launching the US version of our managed-volatility strategy—the first of its kind, we believe—on October 28, 2004.
In addition to being an early implementer, we also brought our manager-of-managers framework to the space. Among other things, this framework provides us with access to some of the best-in-class investment managers. It also allows us to diversify manager-specific risk and to tilt manager allocations in response to economic or market conditions. It additionally provides multiple levels of portfolio monitoring, from individual management firms to SEI’s portfolio managers and SEI’s Risk Management team. Our manager-of-managers expertise has enabled us to work closely with leading investment managers to test, build, implement and further develop our managed-volatility approach—and we have been pleased with the results.
In November 2006, we expanded our suite of managed-volatility solutions by launching the Global Managed Volatility Fund in Europe and the U.K. SEI’s Global Managed Volatility Fund offering in Canada followed in March 2012. SEI also offers tax-managed versions of both its U.S. and international offerings. In a very real sense, SEI has helped pioneer the managed-volatility revolution.
The managed-volatility revolution
Our initial embrace of a managed-volatility approach required an interesting change of mindset. Traditional investment management focuses on a portfolio’s expected return relative to a benchmark; at the same time, it tries to limit the portfolio’s divergence from that benchmark. By doing so, a manager accepts that its portfolio will probably experience benchmark-like volatility. In contrast, when developing our managed-volatility approach, we focused directly on risk. Each of our managed-volatility offerings has a volatility-reduction target compared to its benchmark.
We determined that in order to achieve this objective, our managed-volatility strategies should be sector and industry agnostic. As a result, our sector allocations tend to differ significantly from the broader market. We often dramatically overweight less-volatile sectors and heavily underweight those that are more volatile. As Exhibit 1 shows, the average weights of certain sectors in the Global Managed Volatility Fund diverged substantially from their weights in the MSCI ACWI Index during the third quarter of 2019. The Fund was overweight utilities, consumer staples and healthcare stocks, and underweight the information technology, industrials and consumer discretionary sectors.
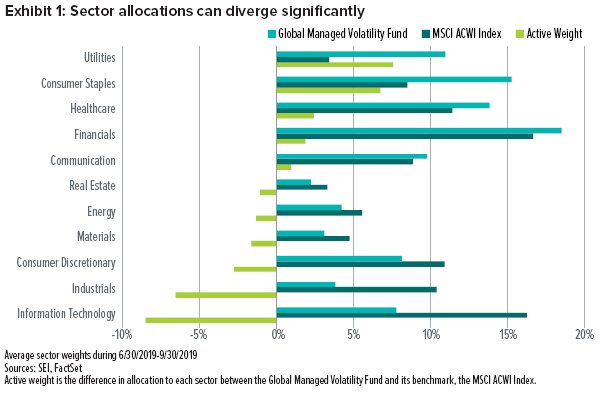
Over short periods of time, our sector-agnostic philosophy can lead to significant return disparities between a managed-volatility portfolio and its benchmark. However, over long periods, we expect returns to be similar to those of the broader stock market (of course, there is no guarantee this will be the case). It is important to note that shifts in sector and industry behaviour do occur. When we or one of our managers see this happening, we will adjust our portfolio accordingly. Our process is empirical and data-driven; we are neither wed to nor averse to certain sectors simply because they behaved a certain way in the past.
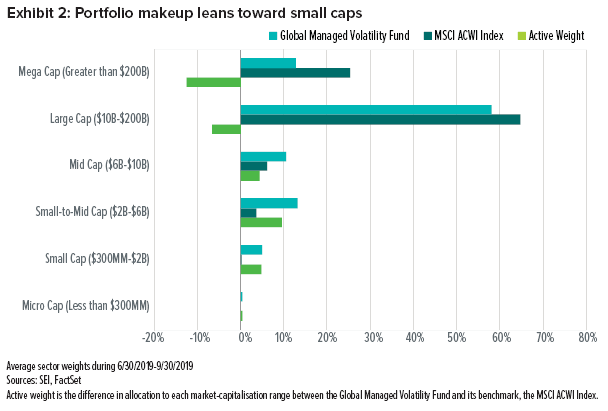
Differences between Fund and benchmark characteristics are further apparent in their distinct market-cap exposures, as one can be vastly different from the other. Over the quarter ending on September 30, 2019, the Fund was generally overweight smaller-cap stocks, while it maintained an underweight to mega-cap and large-cap names compared to its benchmark (Exhibit 2).
Solid performance with downside protection
We have found that one of the historical benefits of a well-designed managed-volatility strategy is an improvement in risk-adjusted returns. Risk-adjusted returns, which can be calculated in different ways, are meant to show the return an investor receives per unit of risk assumed. (Risk is typically measured as the standard deviation, or average dispersion, of a portfolio’s returns.) All else equal, a higher risk-adjusted return indicates that a portfolio has struck a better balance between risk and reward.
As shown in Exhibit 3, the Global Managed Volatility Fund has done just that. Since the Fund’s inception on March 30, 2012, its average monthly return has been 1.04%—very similar to the average monthly returns on the MSCI ACWI Index (Net) (CAD). Our strategic focus is on the next two columns, however. The standard deviation of those returns was 2.15% for the Fund, which is about 20% lower than the standard deviation of its benchmark. This lower volatility also enhanced the Fund’s risk-adjusted returns. As shown in the last column of Exhibit 3, the return per unit of standard deviation was 0.49 for the Global Managed Volatility Fund. This is significantly higher than the 0.38 generated by the benchmark.
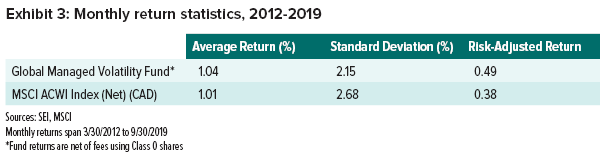
Risk-adjusted return is average return divided by standard deviation. Index returns are for illustrative purposes only and do not represent actual fund performance. Index returns do not reflect any management fees, transaction costs or expenses. Indexes are unmanaged and one cannot invest directly in an index. Past performance does not guarantee future results.
As implied by these return statistics, long-term performance has been solid, and this is shown in Exhibit 4. In fact, although a managed-volatility investor should not expect this to be the norm, the Global Managed Volatility Fund has managed to outpace its benchmark since its inception on a cumulative basis. This cumulative performance edge can be attributed, at least in part, to the fact that the Fund did not suffer as badly as its benchmark during the 2015-16 market selloff or the abrupt market decline in the fourth quarter of 2018. Since inception, in negative months for the MSCI ACWI Index (Net) (CAD), the Fund and the benchmark have averaged -1.14% and -2.22%, respectively.
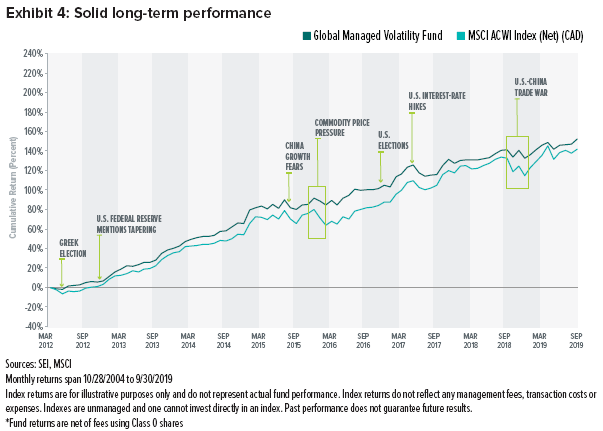
This potential downside protection is another appealing feature of a managed-volatility approach. Intuitively, if a portfolio is less volatile than the overall market, then it should typically lose less value during a steep market decline. This cannot be guaranteed, of course. But in the 2015-2016 selloff, the Fund’s maximum drawdown was close to 6% less than the MSCI ACWI Index (Net) (CAD). More recently, during the fourth-quarter selloff in 2018 that saw many global indexes near bear-market territory, the Fund’s maximum drawdown was approximately 5% less than its benchmark.
We believe our low-volatility approach can serve investors well, helping to lessen the impact of market uncertainty. As always, we think it’s important that investors carefully consider all investment options and select investments based on their individual needs and goals.
Glossary
Drawdown: A drawdown refers to the high-to-low decline over a defined period for an investment and is usually calculated as the percentage move lower from the recent high to low.
Standard Deviation: Standard deviation refers to a formula used to predict potential future volatility of performance. High deviation suggests the outcome could be very different from historical averages, while low suggests the outcome could be closely matched.
Index Definitions
MSCI ACWI Index: The MSCI ACWI Index is a capitalization-weighted index composed of over 2,000 companies, and is representative of the market structure of 46 developed and emerging-market countries in North and South America, Europe, Africa and the Pacific Rim. The index is calculated with net dividends reinvested in U.S. dollars.
Index returns do not reflect any management fees, transaction costs or expenses. Indexes are unmanaged and one cannot invest directly in an index. Past performance does not guarantee future results.
Important Information
SEI Investments Canada Company, a wholly-owned subsidiary of SEI Investments Company, is the Manager of the SEI Funds in Canada.
The information contained herein is for general and educational information purposes only and is not intended to constitute legal, tax, accounting, securities, research or investment advice regarding the Funds or any security in particular, nor an opinion regarding the appropriateness of any investment. This commentary has been provided by SEI Investments Management Corporation (“SIMC”), a U.S. affiliate of SEI Investments Canada Company. SIMC is not registered in any capacity with any Canadian regulator, nor is the author, and information contained herein is for general information purposes only and is not intended to constitute legal, tax, accounting, securities, or investment advice, nor an opinion regarding the appropriateness of any investment. You should not act or rely on the information contained herein without obtaining specific legal, tax, accounting and investment advice from an investment professional. This material represents an assessment of the market environment at a specific point in time and is not intended to be a forecast of future events, or a guarantee of future results. There is no assurance as of the date of this material that the securities mentioned remain in or out of the SEI Funds.
This material may contain “forward-looking information” (“FLI”) as such term is defined under applicable Canadian securities laws. FLI is disclosure regarding possible events, conditions or results of operations that is based on assumptions about future economic conditions and courses of action. FLI is subject to a variety of risks, uncertainties and other factors that could cause actual results to differ materially from expectations as expressed or implied in this material. FLI reflects current expectations with respect to current events and is not a guarantee of future performance. Any FLI that may be included or incorporated by reference in this material is presented solely for the purpose of conveying current anticipated expectations and may not be appropriate for any other purposes.
Information contained herein that is based on external sources or other sources is believed to be reliable, but is not guaranteed by SEI Investments Canada Company, and the information may be incomplete or may change without notice.
There are risks involved with investing, including loss of principal. International investments may involve risk of capital loss from unfavourable fluctuation in currency values, from differences in generally accepted accounting principles or from economic or political instability in other nations.


