Uncertainty has U.S. stocks on the defensive.
Uncertainty in capital markets is running rampant and putting U.S. stocks on the defensive. While it never feels good to see declines, they are actually a frequent occurrence. As always—but especially in turbulent times—we believe diversification is the best defense against volatility.
Stay the course
Fully diversify your portfolio, maintain it in line with your risk tolerance, stay invested, and don’t panic—these are some the core investing principles that we always come back to in turbulent times. While this advice has served long-term investors well, it’s also human nature to question it when markets decline. Although the exact reasons for market downturns are always different, the core principles of sound advice remain the same for any market environment, including today.
Market dips happen often
Uncertainty currently abounds in capital markets; we review the major concerns in the blue call-out box on the next page. When uncertainty rises to this level, there are typically some declines to follow. U.S. stocks have borne the brunt of them thus far. U.S. equities, as measured by the broad-market S&P 500 Index, were hovering near a 10% decline (the level of losses that technically define a market correction) at the time of this writing. Losses of 5%-10% are actually a fairly common occurrence (as shown in Exhibit 1) despite being unsettling to many investors.
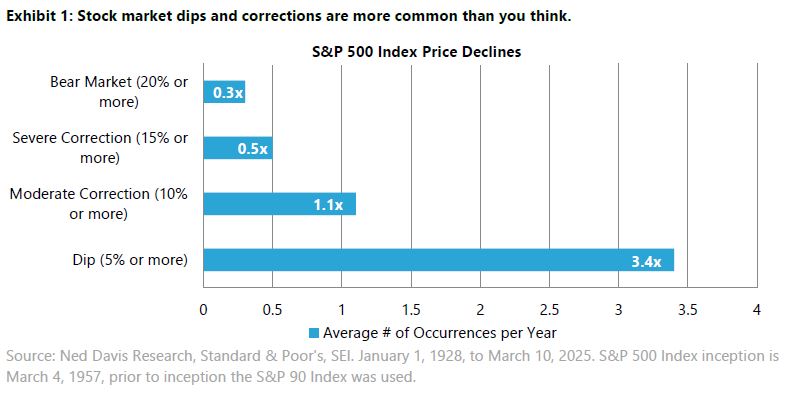
As seen in Exhibit 1, market losses in the 5%-10% range occur on average more than three times a year. It’s actually common (about once a year) to see declines of 10% or more. Obviously, more significant downturns can and do occur, but with much less frequency. It’s important to remember that when looking at long-term market returns, those returns include staying invested during the dips, corrections, and even bear markets—this is a critical component as to why SEI preaches staying invested.
Diversification can help
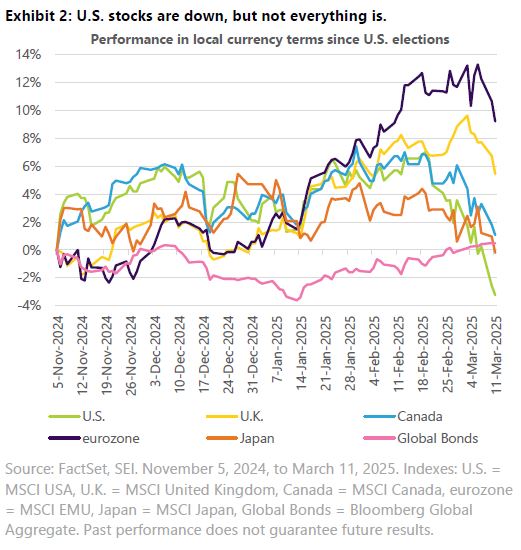
Diversification does not eliminate the risk of loses, but it can help produce a smoother ride by investing in assets with lower correlations to each other. Shortly after the U.S. elections on November 5, 2024, U.S. stocks, as measured by the S&P 500 Index, hit all-time highs as investors generally viewed the incoming Trump administration’s policy as pro-growth and business—tariffs aside, of course. After taking office on January 20, 2025, Trump moved swiftly to enact policies and soon started a trade war. The tariff tiff that this has sparked is a significant reason for uncertainty in markets and U.S. equity losses. Still, not all markets and asset classes are losing ground.
What is SEI doing?
We believe the market conditions have been favorable for active management for some time now. This doesn’t mean making changes to our asset allocations, but to invest where we see opportunities. One opportunity is the theme of “sticky inflation”—in our dynamic portfolios, we are positioned for inflation to continue above the Fed’s 2% target for longer than markets are anticipating. We also emphasize value stocks—those that trade below their perceived fair market value—which has resulted in a corresponding underweight to the high-flying growth stocks that have characterized the AI and Magnificent 7 trades.
As always, remain diversified in your portfolios. If you have not reviewed your risk tolerance and goals recently, now may be a good time to do so to ensure that your investments are aligned with them.
Index definitions
The Bloomberg Global Aggregate Bond Index is a market capitalization-weighted index that tracks the performance of investment-grade (rated BBB- or higher by S&P Global
Ratings/Fitch Ratings or Baa3 or higher by Moody’s Investors Service) fixed-income securities denominated in 13 currencies. The index reflects reinvestment of all distributions and changes in market prices.
The MSCI Canada Index tracks the performance of the large- and mid-cap segments of the Canada equity market.
The MSCI EMU Index (European Economic and Monetary Union) captures large and mid-cap representation across the 10 Developed Markets countries in the EMU. With 221 constituents, the index covers approximately 85% of the free float-adjusted market capitalization of the EMU.
The MSCI Japan Index tracks the performance of the large- and mid-cap segment of the Japanese equity market. The index’s 237 constituents comprise approximately 85% of the free float-adjusted (i.e., including only shares that are available for public trading) market capitalization in Japan.
The MSCI United Kingdom Index is designed to measure the performance of the large and mid-cap segments of the U.K. market. With 78 constituents, the index covers approximately 85%of the free float-adjusted market capitalization in the U.K.
The MSCI USA Index tracks the performance of the large- and mid-cap segments of the U.S. equity market. The index’s 624 constituents comprise approximately 85% of the free float-adjusted (i.e., including only shares that are available for public trading) market capitalization in the U.S.
The S&P 90 Index is a market-weighted index that tracks the performance of the 90 largest publicly traded U.S. companies and is considered representative of the broad U.S. stock market. The index is no longer actively tracked and is used to provide data prior to the inception of the S&P 500.
The S&P 500 Index is a market-weighted index that tracks the performance of the 500 largest publicly traded U.S. companies and is considered representative of the broad U.S. stock market.
Important information
This material represents an assessment of the market environment at a specific point in time and is not intended to be a forecast of future events or a guarantee of future results. All information as of the date indicated. There are risks involved with investing, including possible loss of principal. This information should not be relied upon by the reader as research or investment advice, (unless you have otherwise separately entered into a written agreement with SEI for the provision of investment advice) nor should it be construed as a recommendation to purchase or sell a security. The reader should consult with their financial professional for more information.
Statements that are not factual in nature, including opinions, projections and estimates, assume certain economic conditions and industry developments and constitute only current opinions that are subject to change without notice. Nothing herein is intended to be a forecast of future events, or a guarantee of future results.
Certain economic and market information contained herein has been obtained from published sources prepared by other parties, which in certain cases have not been updated through the date hereof. While such sources are believed to be reliable, neither SEI nor its affiliates assumes any responsibility for the accuracy or completeness of such information and such information has not been independently verified by SEI.
There are risks involved with investing, including loss of principal. The value of an investment and any income from it can go down as well as up. Investors may get back less than the original amount invested. Returns may increase or decrease as a result of currency fluctuations. Past performance is not a reliable indicator of future results. Investment may not be suitable for everyone.
Diversification does not ensure a profit or guarantee against a loss. International investments may involve risk of capital loss from unfavorable fluctuation in currency values, from differences in generally accepted accounting principles or from economic or political instability in other nations. Emerging markets involve heightened risks related to the same factors as well as increased volatility and lower trading volume. Narrowly focused investments and smaller companies typically exhibit higher volatility. Bonds and bond funds will decrease in value as interest rates rise. High-yield bonds involve greater risks of default or downgrade and are more volatile than investment-grade securities, due to the speculative nature of their investments.
Index returns are for illustrative purposes only and do not represent actual investment performance. Index performance returns do not reflect any management fees, transaction costs or expenses. Indexes are unmanaged, and one cannot invest directly in an index. Past performance does not guarantee future results.
This material is not directed to any persons where (by reason of that person's nationality, residence or otherwise) the publication or availability of this material is prohibited. Persons in respect of whom such prohibitions apply must not rely on this information in any respect whatsoever.
The views contained herein are not to be taken as advice or a recommendation to buy or sell any investment in any jurisdiction. Our outlook contains forward-looking statements that are judgments based upon our current assumptions, beliefs, and expectations. If any of the factors underlying our current assumptions, beliefs or expectations change, our statements as to potential future events or outcomes may be incorrect. We undertake no obligation to update our forward-looking statements.
The information contained herein is for general and educational information purposes only and is not intended to constitute legal, tax, accounting, securities, research or investment advice regarding the strategies or any security in particular, nor an opinion regarding the appropriateness of any investment. This information should not be construed as a recommendation to purchase or sell a security, derivative or futures contract. You should not act or rely on the information contained herein without obtaining specific legal, tax, accounting and investment advice from an investment professional.
SEI sources data directly from FactSet, Lipper, and BlackRock unless otherwise stated.
Information in the U.S. is provided by SEI Investments Management Corporation (SIMC), a wholly owned subsidiary of SEI Investments Company (SEI).
Information in Canada is provided by SEI Investments Canada Company, a wholly owned subsidiary of SEI Investments Company (SEI), and the Manager of the SEI Funds in Canada.
In the UK and the EEA this information issued in the UK by SEI Investments (Europe) Ltd, 1st Floor, Alphabeta, 14-18 Finsbury Square, London EC2A 1BR which is authorised and regulated by the Financial Conduct Authority.
The contents of this document have not been reviewed by any regulatory authority in Hong Kong. You are advised to exercise caution in relation to the offer. If you are in any doubt about any of the contents of this document, you should obtain independent professional advice. This document has not been registered as a prospectus with the Monetary Authority of Singapore.
This information is made available in Latin America and the Middle East FOR PROFESSIONAL (non-retail) USE ONLY by SIEL.
This document has not been approved by the Israel Securities Authority and will only be distributed to Israeli residents in a manner that will not constitute "an offer to the public" under sections 15 and 15A of the Israel Securities Law, 5728-1968 (the “Securities Law") or section 25 of the Joint Investment Trusts Law, 5754-1994 (the "Joint Investment Trusts Law"), as applicable.
Any questions you may have in relation to its contents should solely be directed to your Distributor. If you do not know who your Distributor is, then you cannot rely on any part of this document in any respect whatsoever.
Issued in South Africa by SEI Investments (South Africa) (Pty) Limited FSP No. 13186 which is a financial services provider authorised and regulated by the Financial Sector Conduct Authority (FSCA). Registered office: 3 Melrose Boulevard, 1st Floor, Melrose Arch 2196, Johannesburg, South Africa.


