“Chimerica” consciously uncouples.
Niall Ferguson, a well-known historian and Harvard University professor, coined the term “Chimerica” in 2006. It was a clever way to underscore the fact that the Chinese and American economies had become so intertwined that they could be viewed as one economy. As Professor Ferguson pithily observed in a 2009 article, “The Chinese did the saving, the Americans the spending. The Chinese did the exporting, the Americans the importing. The Chinese did the lending, the Americans the borrowing.”
That symbiotic, yet unsustainable, relationship started fraying about 15 years ago in the aftermath of the financial crisis. The excruciatingly slow U.S. recovery from its deepest economic recession of the post-World War II period, and the economic pain sustained by those who lived in communities that lost their manufacturing base, led to widespread disillusionment about the benefits of free trade. At the same time, there was a growing belief that China was no longer living up to the spirit of its World Trade Organization (WTO) agreement to open its markets to other countries in exchange for full integration into the global trading system. Subsidizing Chinese state enterprises, thereby giving them an unfair competitive advantage, and forcing foreign companies to share proprietary information and technology as a quid pro quo for market access, became irritants as well. China’s muscle-flexing in the East China Sea and the South China Sea under the regime of President Xi Jinping, not to mention its frequently intimidating behavior around the island of Taiwan, created a geopolitical dimension to the rising economic tensions between China and the United States. This deterioration picked up steam during the first Trump Administration and was compounded by the COVID-19 pandemic, which underscored the unreliability of China as a trading partner of critical goods such as personal protection equipment.
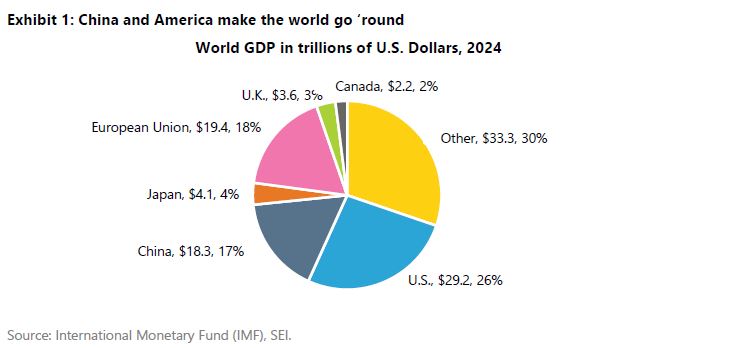
The ratcheting-up of trade-war tensions between the U.S. and China has now reached the point where the flows of goods and services between the two nations will fall precipitously in the absence of a scaling back of the sky-high tariffs that both countries have imposed on the other (145% on Chinese goods, 125% on U.S. goods). This is a battle between two economic elephants; other countries will try to avoid getting trampled. Whatever happens between them has implications globally across economies and financial markets. As shown in Exhibit 1 on the following page, China and America together accounted for 43% of world nominal gross domestic product (GDP) last year, with shares of 17% and 26%, respectively, in U.S. dollar terms. No other single country comes close: The other big trading bloc―the European Union (EU)—comprises 18% of world GDP. However, that grouping is composed of 27 countries. The biggest member of the EU is Germany, which accounts for a mere 4.3% of world GDP.
Multinational companies’ supply chains have become extraordinarily integrated in recent decades. The North American Free Trade Agreement (NAFTA), established in 1994, closely tied the U.S., Canada, and Mexico in a relationship that even the Trump Administration appears reluctant to undo completely despite the harsh rhetoric coming out of the White House. It is true that a tariff of 25% has been placed on aluminum and steel as well as non-USMCA (United States-Mexico-Canada Agreement)-compliant goods. But USMCA-compliant products, representing roughly 50% of Mexican exports to the U.S. and almost 40% of Canadian exports, remain exempt from any tariffs, including the 10% baseline tariff that is applied to nearly all other countries. In addition to the North American trading bloc, the eastward expansion of the European Community (the predecessor to the EU) after the collapse of the Soviet Union in 1989, and the establishment of the eurozone in 1999, provided an economic boon to Europe (at least, until the global financial crisis hit in the late 2000s, followed by the 2010 debt debacle in Greece and other European periphery countries). But the biggest catalyst to global growth was the accession of China to the WTO in 2001. This global trading framework is now in jeopardy.
Prior to the escalation of the trade war, supply-chain pressures were still quite subdued, according to data published by the Federal Reserve Bank of New York. The Global Supply Chain Pressure Index, highlighted in Exhibit 2, measures transportation costs and supply-chain-related components derived from IHS Markit’s Purchasing Managers’ Index.
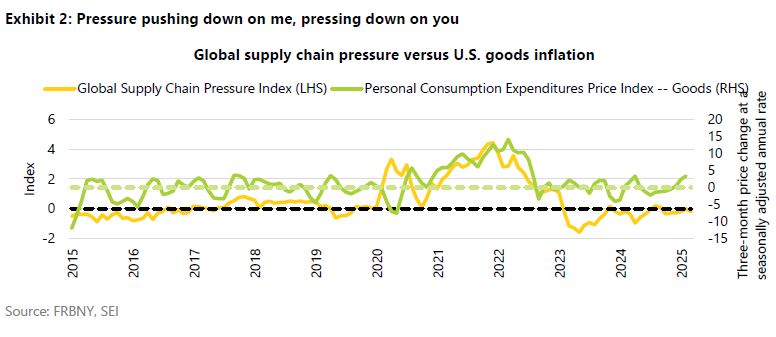
It uses survey data from manufacturers across seven interconnected economies: China, Japan, South Korea, Taiwan, the U.K., the U.S., and the euro area. This index strips out demand to isolate the pressures affecting global supply chains. During COVID-19 and its aftermath, supply chains were severely disrupted, leading to delays and shortages that aggravated the inflation surge at the time. This statistic will be worth watching in the coming months as the tariffs on China begin to bite and companies struggle to adjust their supply chains. In addition, the Trump Administration is threatening to impose fees on Chinese-built and owned vessels docking in the U.S., driving up shipping costs even more. Goods inflation might not reach the heights recorded in 2021, but it could accelerate into the 5%-to-10% range at least temporarily.
Will a rocky marriage turn into a messy divorce?
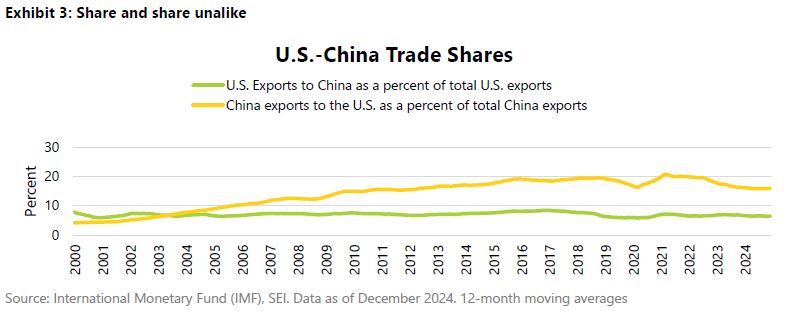
In March 2014, actress Gwyneth Paltrow announced that she and her then-husband Chris Martin were separating. It was apparently a friendly break-up. It was, as she called it, a “conscious uncoupling.” The uncoupling of China and the U.S., by contrast, appears more vengeful than friendly and accompanied by a host of grievances that goes back many years. Like a marriage that has been on the rocks for a while, both parties have been drifting apart for some time. As we show in Exhibit 3, the share of China’s total exports to the U.S. has fallen to its lowest point in 12 years, from a high of roughly 20% to a recent reading closer to 15%. This share will collapse if the trade war rages on unabated. Meanwhile, the share of U.S. exports shipped to China is not much higher now than it was when China first entered the WTO. China may suffer more from the trade stoppage, but the direct impact would not be more than 2.5% of the country’s GDP.
The U.S. will suffer too
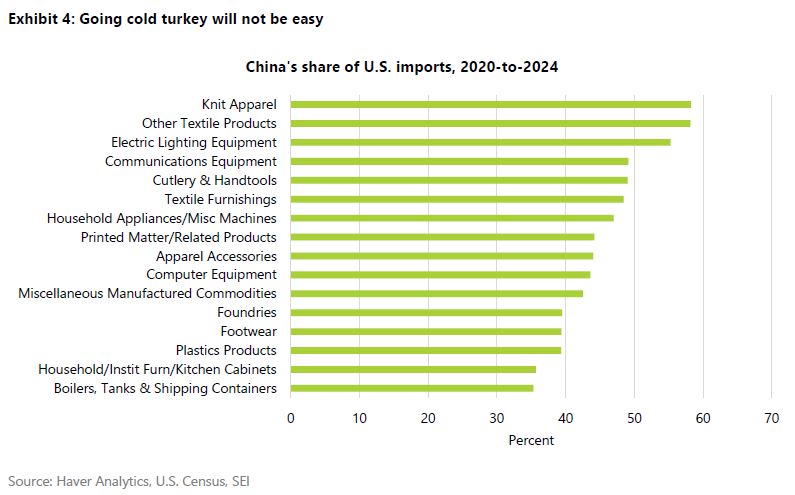
Although the U.S. exports considerably less to China than China exports to us, American households and businesses will feel considerable pain. Fortunately, Trump has granted a reprieve from tariffs for cell phones, computers, and other electronic goods. But there is so much more for which the U.S. depends on China as a primary supplier. Exhibit 4 highlights China’s share of U.S. imports for a selection of numerous industries. The country accounts for more than 50% of the goods imported into the U.S. for knit apparel, other textile products, and electric lighting equipment. The share exceeds 40% for several more industries. It will be hard for other trading partners to take up the slack given their own capacity constraints. The result likely will be supply shortages, reduced consumer choice, and higher prices for many goods.
We find it inconceivable that the Trump Administration will maintain a tariff regime that cuts off practically all trade with China. Treasury Secretary Scott Bessent has said as much. Nonetheless, the de-escalation process could be tricky since neither party wants to “lose face.” There also is little chance that relations between the two countries will return to the status quo ante. Trump’s negotiating style is now well known. He establishes a maximalist position that borders on the outrageous; he then negotiates downward from there with the aim of achieving his goal. We think he really wants to wean America from its dependency on China and to prevent that country from achieving economic and geopolitical parity with the U.S. Tariffs will almost certainly end up permanently higher on most goods.
Although we believe that the imposition of tariffs will have a negative impact on growth, inflation, and corporate profitability, it is not at all clear how deleterious it will be. There are a lot of moving parts to consider. For example, China may choose to continue to devalue its currency to maintain its competitive edge. There are other alternatives to renminbi devaluation, however. For example, if a Chinese company or China-based subsidiary of a multinational corporation exports a critical intermediate component or a much-desired consumer product, the cost of the tariff will likely be borne mostly by the U.S. buyer. If the item produced enjoys a high profit margin, the importing company might instead absorb most of the extra cost. Low-tech goods with narrow profit margins, such as shoes and clothing, might need to be made elsewhere, in a low-cost locale like Vietnam, Bangladesh, or Laos. How quickly supply chains can be relocated will be a critical factor exacerbating or tempering the tariff impact on China and on U.S. consumers and companies. It will depend on the complexity of the manufacturing process, the ability and educational level of the local workforce, and the available capacity and infrastructure of the potential host country.
As the trade war with China heats up, the Trump Administration has turned more conciliatory toward other countries with which it has picked fights. The threat of reciprocal tariffs on other trading partners, for example, has been taken off the table at least for the next few months. Although this concession is characterized as a pause, we are hopeful that it represents a realization by the White House that it’s better to gain allies in its battle against China than fight on multiple fronts.
Don’t just do something – sit there!
The uncertainty generated by the Trump Administration’s trade policies has roiled markets to an unnerving degree. Stocks, bonds and currencies have registered a sharp rise in volatility. However, the actual damage to portfolios has been rather limited to this point, all things considered. The MSCI USA Total Return Index is down 12% for the year-to-date, but corrections of 20% have occurred on several occasions since the global financial crisis, most recently in 2022. Meanwhile, the MSCI World ex USA Total Return Index has climbed 7% over the same span, thanks in part to the decline in the value of the U.S. dollar, while the yield on the benchmark 10-year U.S. Treasury note is almost 20 basis points lower than at the start of the year. The Magnificent Seven and the technology sector generally have been hit hard, but this part of the market had become exceptionally expensive. The technology sector’s price/earnings multiple on analysts’ year-ahead earnings estimates has collapsed from a high of 27 times at the peak on February 19, to a current reading of 21, a far more reasonable valuation.
Predicting the future is a hazardous venture most of the time. In view of the uncertainties facing investors, the prediction game is, perhaps, even more challenging now. Maintaining exposure to risk assets may feel uncomfortable. Nonetheless, for institutional and individual investors who have reasonably long time horizons, it pays to keep in mind that mistiming entries and exits into and out of equities can be quite costly. It is historically better to just stand pat than make wholesale changes to a portfolio that will alter the portfolio’s risk and return profile in a manner that conflicts with the investor’s strategic goals.
There is no disputing that policy uncertainty is particularly high at present. Trump’s tariff war is a threat to the rules-based world order that has (for the most part) benefited the U.S., but it is too soon to assume the worst. Trump has already walked away from some of his most ill-conceived tariff proposals. There probably will be more modifications to come as the negotiations with trading partners ramp up. In the interim, we believe that strategic portfolio positioning favoring value, momentum, and quality, and broad diversification across assets and geographies, should help to limit the damage.
Glossary
Gross domestic product (GDP) is the total monetary or market value of all the goods and services produced in a country during a certain period.
Magnificent 7 refers to a group of seven large-cap technology companies (Alphabet, Amazon, Apple, Meta, Microsoft, Nvidia, and Tesla) that have significantly influenced market indices like the S&P 500 due to their strong performance and market dominance.
Momentum is a trend-following investment strategy that is based on acquiring assets with recent improvement in their price, earnings, or other relevant fundamentals.
Price/earnings multiple is calculated by dividing the current market price of a stock by the earnings per share. Price/earnings multiples often are used to compare companies in the same industry, or to assess the historical performance of an individual company.
Quality comprises a long-term buy-and-hold strategy that is based on acquiring shares of companies with strong and stable profitability with high barriers of entry (factors that can prevent or impede newcomers into a market or industry sector, thereby limiting competition).
Value is an investment strategy that is based on acquiring assets at a discount to their fair valuations. Mean reversion is a theory that prices and returns eventually move back towards their historical average.
Index definitions
The Global Supply Chain Pressure Index is a measure developed by the Federal Reserve Bank of New York to gauge the intensity of disruptions to global supply chains. It combines data from various sources, including transportation costs, manufacturing indicators, and inventory levels.
The IHS Markit’s Purchasing Managers’ Index is a monthly survey of purchasing managers in the manufacturing and services sectors, providing insights into the health of an economy. Readings above 50 indicate expansion, while below 50 suggest contraction.
The MSCI USA Index tracks the performance of the large- and mid-cap segments of the U.S. equity market. The index’s 624 constituents comprise approximately 85% of the free float-adjusted (i.e., including only shares that are available for public trading) market capitalization in the U.S.
The MSCI World ex USA Index tracks the performance of the large- and mid-cap segments of equity markets across 22 of 23 developed- market countries--excluding the U.S.
The S&P® 500 Index is a market-weighted index that tracks the performance of the 500 largest publicly traded U.S. companies and is considered representative of the broad U.S. stock market.
Important information
This material represents an assessment of the market environment at a specific point in time and is not intended to be a forecast of future events or a guarantee of future results. Positioning and holdings are subject to change. All information as of the date indicated. There are risks involved with investing, including possible loss of principal. This information should not be relied upon by the reader as research or investment advice, unless you have otherwise separately entered into a written agreement with SEI for the provision of investment advice) nor should it be construed as a recommendation to purchase or sell a security. The reader should consult with their financial professional for more information.
Statements that are not factual in nature, including opinions, projections and estimates, assume certain economic conditions and industry developments and constitute only current opinions that are subject to change without notice. Nothing herein is intended to be a forecast of future events, or a guarantee of future results.
Certain economic and market information contained herein has been obtained from published sources prepared by other parties, which in certain cases have not been updated through the date hereof. While such sources are believed to be reliable, neither SEI nor its affiliates assumes any responsibility for the accuracy or completeness of such information and such information has not been independently verified by SEI.
There are risks involved with investing, including loss of principal. The value of an investment and any income from it can go down as well as up. Investors may get back less than the original amount invested. Returns may increase or decrease as a result of currency fluctuations. Past performance is not a reliable indicator of future results. Investment may not be suitable for everyone.
Index returns are for illustrative purposes only and do not represent actual investment performance. Index performance returns do not reflect any management fees, transaction costs or expenses. Indexes are unmanaged, and one cannot invest directly in an index. Past performance does not guarantee future results.
This material is not directed to any persons where (by reason of that person's nationality, residence or otherwise) the publication or availability of this material is prohibited. Persons in respect of whom such prohibitions apply must not rely on this information in any respect whatsoever.
The information contained herein is for general and educational information purposes only and is not intended to constitute legal, tax, accounting, securities, research or investment advice regarding the strategies or any security in particular, nor an opinion regarding the appropriateness of any investment. This information should not be construed as a recommendation to purchase or sell a security, derivative or futures contract. You should not act or rely on the information contained herein without obtaining specific legal, tax, accounting and investment advice from an investment professional.
The views contained herein are not to be taken as advice or a recommendation to buy or sell any investment in any jurisdiction. Our outlook contains forward-looking statements that are judgments based upon our current assumptions, beliefs, and expectations. If any of the factors underlying our current assumptions, beliefs or expectations change, our statements as to potential future events or outcomes may be incorrect. We undertake no obligation to update our forward-looking statements.
Information in the U.S. is provided by SEI Investments Management Corporation (SIMC), a wholly owned subsidiary of SEI Investments Company (SEI).
Information provided in Canada by SEI Investments Canada Company, the Manager of the SEI Funds in Canada.
In the UK and the EEA this information issued in the UK by SEI Investments (Europe) Ltd, 1st Floor, Alphabeta, 14-18 Finsbury Square, London EC2A 1BR which is authorised and regulated by the Financial Conduct Authority. Investments in SEI Funds are generally medium- to long-term investments.
The contents of this document have not been reviewed by any regulatory authority in Hong Kong. You are advised to exercise caution in relation to the offer. If you are in any doubt about any of the contents of this document, you should obtain independent professional advice.
This document has not been registered as a prospectus with the Monetary Authority of Singapore.
This information is made available in Latin America, the Middle East and Australia FOR PROFESSIONAL (non-retail) USE ONLY by SIEL.
Any questions you may have in relation to its contents should solely be directed to your Distributor. If you do not know who your Distributor is, then you cannot rely on any part of this document in any respect whatsoever.
SIEL is not licensed under Israel’s Regulation of Investment Advising, Investment Marketing and Portfolio Management Law, 5755-1995 (the “Advice Law”) and does not carry insurance pursuant to the Advice Law. No action has been or will be taken in Israel that would permit a public offering or distribution of the SEI Funds mentioned in this email to the public in Israel. This email and any of the SEI Funds mentioned herein have not been approved by the Israeli Securities Authority (the “ISA”).
Issued in South Africa by SEI Investments (South Africa) (Pty) Limited FSP No. 13186 which is a financial services provider authorised and regulated by the Financial Sector Conduct Authority (FSCA). Registered office: 3 Melrose Boulevard, 1st Floor, Melrose Arch 2196, Johannesburg, South Africa.


