Economic outlook: Inflation: Another import from the U.S. (Long Version)
It’s hard having the United States as your neighbour and largest trading partner. When it gets a cold, you might just get pneumonia. The biggest malady in America at the moment is inflation, and Canada has contracted the illness in a big way. Exhibit 1 shows that core consumer prices in both countries have soared together.
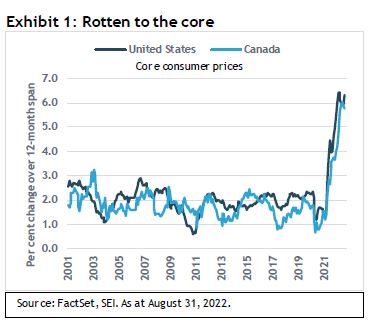
The U.S. has recorded a year-over-year jump of 6.3% through August, while Canada’s increase amounts to 5.7%. Both countries have not only accelerated from their pandemic lows, but both are enduring price gains that are more than triple the averages (1.8% per annum for Canada, 2.0% for the United States) between 2001 and 2020.
To be sure, a fair measure of Canada’s inflation woes are home grown. As we show in Exhibit 2, the average hourly wage rate and total compensation per hour have been on the rise, with the former exceeding a 5% growth rate on a year-over-year basis. Outside of the distortion caused by the pandemic in the spring and summer of 2020, this is the swiftest rise in wages in at least two decades.
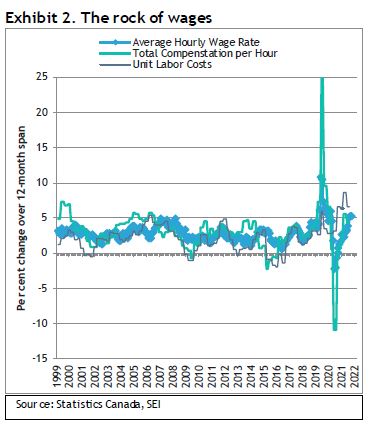
As in the U.S., labour productivity (output per hour) has been sagging, aggravating the jump in unit labour costs. At a year-over-year rate of 6.6% through the second quarter, the climb in unit labour costs isn’t as bad as it’s been in the U.S., but it is still bad. As the economy slows further, we should anticipate more weakness in the productivity numbers and a cyclical rise in unit labour costs.
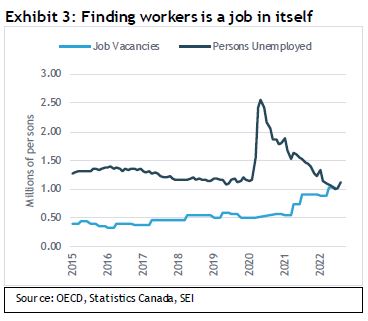
As in the U.S., the labour market is as tight as a drum. There are roughly as many job vacancies in Canada as there are the number of officially unemployed persons. Although the dataset is limit, lack of workers appears far more problematic than at any time between 2015 and 2019, just prior to the onset of COVID. No wonder the government is trying to encourage more immigration. As long as this situation lasts, wages will probably press higher until an economic downturn materializes.
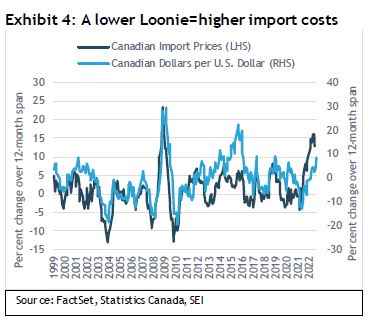
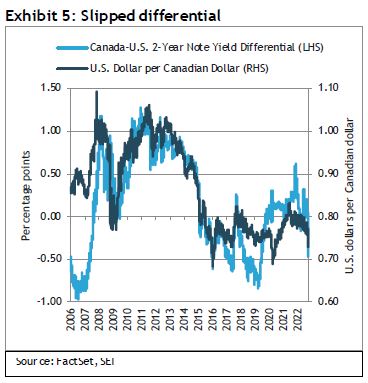
Canadian import prices are advancing at more than twice the pace of overall inflation, although the rate of change appears to have eased between May and July. Whether that improvement continues essentially depends upon how fast the inflation of goods and services imported from the U.S. declines. Unfortunately, the U.S. dollar has been rising rapidly of late against the Canadian dollar. Over the 12 months ended September, the greenback has rallied 10% against the Canadian currency, as seen in Exhibit 4. During the Global Financial Crisis, the U.S. dollar soared nearly 30% in a year’s time; import prices rose almost 25% over the same period, yet Canada’s consumer price index hardly budged because the associated recession was deep and deflationary. By contrast, Canadian gross domestic product (GDP) was up 4.6% in inflation-adjusted terms from the year-ago period as of the second quarter. Given the far tighter labour-market conditions that exist today, We expect a fuller pass-through of high imported inflation into consumer prices.
In Exhibit 5, we invert the currency relationship and show howmany U.S. dollars the Loonie buys. Currently, it’s not very much ($0.73 versus $0.79) at the end of last year. Although cheaper, the currency is cheaper for a good reason: The interest-rate differential between Canadian and U.S. two-year Treasury notes favours the U.S. by 41 basis points, the largest spread in three years and far below the 60 basis-point differential in favour of Canadian yields reached in November 2021. So far, the Bank of Canada has merely kept pace with the Federal Reserve’s (Fed) policy-rate increases.
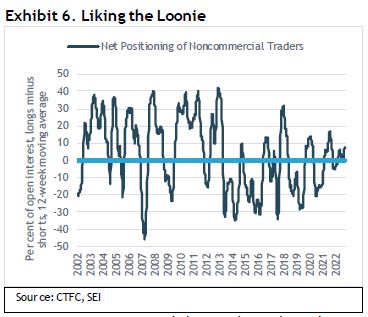
We note elsewhere that overly bullish positioning in the dollar by speculative (noncommercial) traders suggests that the dollar is vulnerable to at least a temporary decline versus the major currencies.
Positioning against the Loonie, however, does not seem quite as extreme as it does against the pound, euro or yen. In fact, noncommercial traders currently appear to have a net long position in the Canadian dollar, as we show in Exhibit 6. Canada’s role as a major oil and commodities producer, and its strong economic ties to the U.S., may explain why speculators are not enthusiastically shorting the currency.
In all, SEI is not convinced that the Bank of Canada can deviate from the monetary policy path the Fed is taking. To do so risks weakening the Canadian currency and adding to inflationary pressures. This is a particular problem for the housing market. Residential fixed investment as a percentage of GDP is considerably higher in Canada than it is in the United States. Housing activity soared in 2020, with the volume of residential fixed capital formation reaching 8.7% of GDP in the first quarter of 2021. The share of economic activity accounted for by the housing sector has since fallen back but it is still above the previous cyclical peaks of past cycles. During the Global Financial Crisis, the volume of gross fixed capital formation fell in Canada but quickly bounced back. By contrast, residential investment slid precipitously as a share of overall business activity in the United States between 2005 and 2009; it has recovered only tepidly since.
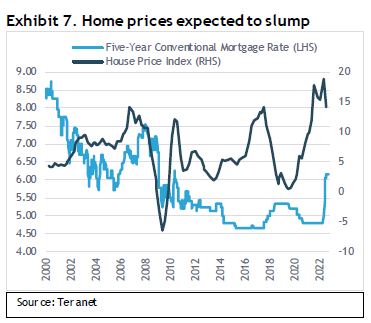
Mortgage rates in Canada have taken a leap this year as we show in Exhibit 7. Five-year conventional mortgage rates may move higher still in the months ahead as the Bank of Canada strives to bring inflation down and maintain a stable currency against the U.S. dollar. Home prices, which were up 14% year-over-year as of July, will almost certainly moderate further, perhaps sinking into negative territory before all is said and done. Although the economy is in a good position to weather the harder times that might lie ahead, the housing market could prove to be a major drag on overall household consumption and wealth in 2023.
Hard times
Good news is tough to find these days, while bad news has plenty of company. The litany of ills threatening economic growth and battering financial markets include Russia’s war in Ukraine; Russia’s energy blackmail against Europe; high global inflation; central banks’ aggressive response to rising prices; and China’s severe COVID-19-related economic slowdown that continues to wreak havoc on the global supply chain. Even Mother Nature has added to the challenges. Drought conditions in large swathes of the U.S., Europe, China, and the Horn of Africa have placed 22 million people at risk of starvation according to the UN’s World Food Programme. At the opposite end of the spectrum, a devastating hurricane season has brought such severe flooding and wind damage to parts of the Caribbean and the U.S. that full recovery will take years.
None of these concerns is exactly new; they have simply increased in intensity. Most important (from an economic perspective) is that monetary-policy makers now must finally acknowledge the major inflation problem on their hands, one that is neither transitory nor resolved without pain. Federal Reserve (Fed) Chair Jerome Powell’s speech at Jackson Hole (with its many references to pain) and the Federal Open Market Committee’s (FOMC) new economic and rate projections leave no doubt that the U.S. central bank is intent on pushing interest rates to whatever level is needed to bring inflation down. A federal-funds rate that exceeds 5% would not surprise us. Other central banks are following the Fed’s lead, talking tough and implementing outsized interest-rate increases. In the U.K., the bond market has gone haywire and the country’s currency has come under intense downward pressure. To use a newly popular phrase among economists and financial-market participants, things are starting to break.
Reminiscent of the late 1960s and early 1970s, today’s labour, energy, agricultural, supply-chain, health, and climate crises present policymakers with an acute dilemma. Supply constraints have been so severe that inflation is outpacing incomes to an extent seldom seen even during recessions. This is especially so in the countries of continental Europe, where wages have been slow to adjust upward even as inflation itself has soared. We show this in Exhibit 8.
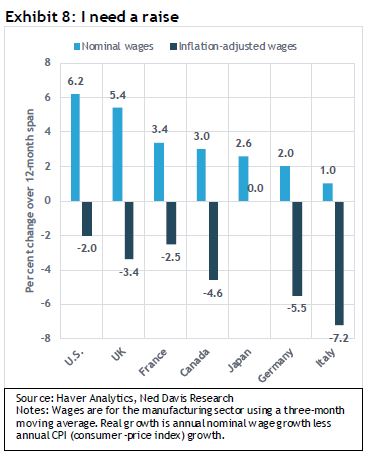
Among the G-7 countries (the world's largest developed economies), Italy and Germany recorded the steepest declines in inflation-adjusted wages, 7.2% and 5.5%, respectively, over the 12 months ended August. The U.S. and the U.K., by contrast, have both recorded a sharp acceleration in wage growth, mitigating the overall drop in real incomes. The latter two countries, however, are in danger of experiencing a wage-price spiral. With the possible exception of Japan, we expect to see a much sharper rise in nominal wage growth among developed countries in the months ahead as workers clamor for relief.
Europe will continue to be the area most under pressure due to Russia’s suspension of natural gas exports through the Nord Stream 1 pipeline and the recent act of sabotage that has damaged both the Nord Stream 1 and Nord Stream 2 pipelines. Although storage facilities within the European Union (EU) are currently 80% to 90% full, the continent needs to have a steady flow of gas to get through the high-usage winter months. The absence of Russian gas may force governments to impose disruptive restrictions on business users and exhort their populations to comply with energy-saving measures. Heavy users of electricity, from aluminum smelters to glassmakers, have already been shutting down. This will likely badly affect Germany and its supplier-countries in central Europe. Even if Europe manages to keep homes heated this winter, reduced flows of gas will almost certainly make it more difficult to prepare for the 2023-to-2024 winter.
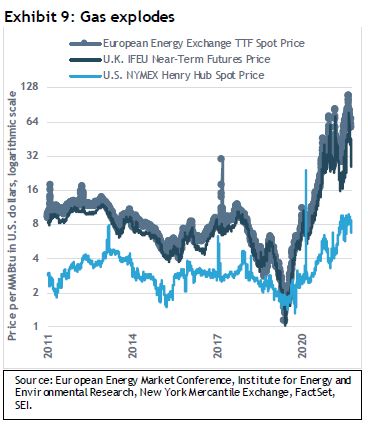
The latest stoppage spurred another intense bout of volatility in European natural gas prices, as seen in Exhibit 9 on the following page. Converting to million British thermal units (MMBtu), the current EU natural-gas price in U.S. dollar terms equals a stunning $60 MMBtu versus $6.67 for the U.S. wholesale price of Henry Hub natural gas and $39 for the near-term futures contract of the U.K. equivalent as of September 30. European natural gas briefly soared to more than $100 per MMBtu in late August.
Although there was a substantial easing toward the end of the third quarter, the price of this critical energy feedstock remains extraordinarily high. As recently as May 2020, European natural gas hit a pandemic-influenced low of just $1.12 per MMBtu.
Electricity prices at the consumer level have not risen nearly as furiously as natural gas prices, increasing 40% across the euro area over the past 12 months ended June. In part, the slower rise merely reflects the fact that electricity producers use a variety of energy sources, including petroleum, natural gas, coal, nuclear energy, and renewables. In addition, consumers’ electricity bills are adjusted only periodically. Governments also are seeking ways to ease the pain through price caps, consumer subsidies and rebates, and reductions in the electricity tax.
Exhibit 10 compares the annual rise in electricity prices across the G-7. Italy and the U.K. have endured the sharpest gains in consumer electricity costs over the past year.
Canada and France, by contrast, have seen relatively mild increases. Canada’s position as a fossil-fuel-rich country has shielded it from the electricity price shock, while France gets the bulk of its electricity from nuclear plants and tends to be a net electricity exporter (although drought conditions severely limited nuclear-plant production during the summer of 2022). Canada and France appear best positioned, along with the U.S., to weather the energy storm as the Northern hemisphere moves into winter.
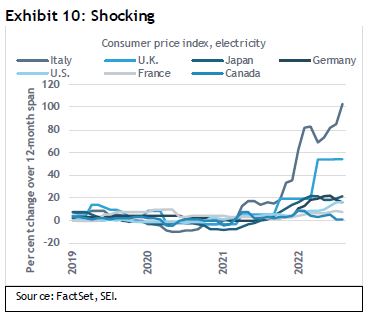
Exhibit 11 highlights the amount of funds that European countries already allocated to shielding households from the energy crisis. In the U.K., Prime Minister Liz Truss rolled out a plan to cap the cost of residential electricity at £2,500 per year over the next 18 months. Analysts at Brussels-based think tank Bruegel estimate that the package could cost £150 billion over the next 18 to 24 months.
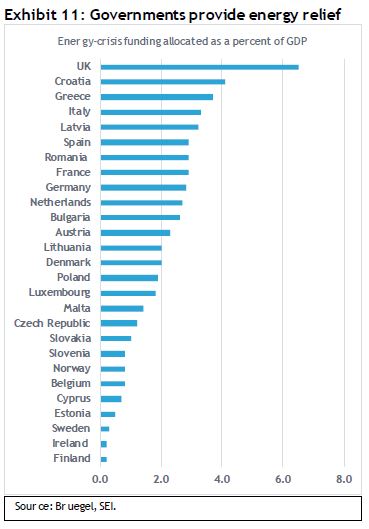
Along with measures previously announced, allocated funding thus far totals £180 billion—or 6.5% of GDP. Other countries that have allocated funds for energy-related relief in excess of 3% of GDP include Croatia, Greece, Italy, and Latvia. It would not be surprising to see more energy-related fiscal relief.
As far as the U.K. is concerned, fiscal support does not end there. In late September, the new government unveiled a £45 billion “mini-budget” that included the biggest tax cut in 50 years. Although amounting to just 1.6% of GDP, it has spawned tremendous price volatility in gilts and sterling because the cost of the package, along with the far-more expensive energy-relief measures, would be covered almost completely through debt issuance. Countries in the EU, by contrast, are instituting a windfall-profits tax to defray at least partially the cost of energy-support packages. Of course, such a windfall tax on producers could discourage future production while reducing the price of electricity and thereby encouraging higher usage. Whatever the outcome, the fiscal position of all European countries will likely see severe deterioration, reversing the improvement made in the past year.
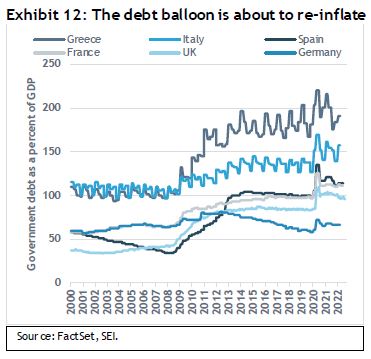
A reduction in pandemic-related emergency spending programs and the surge in tax revenues associated with the post-COVID economic rebound sharply reduced the size of the economies of European countries over the past year, as shown in Exhibit 12. Deficits could balloon much in the same way as they did during the early months of the COVID-19 crisis, depending on the actual emergency packages enacted, the price trajectory of natural gas and other energy inputs, and the extent of economic deterioration.
Between the second quarter of 2019 and the second quarter of 2020, government debt as a percentage of GDP rose an average of 28 percentage points across the six countries highlighted in the chart above. Even after the economic recovery, debt as a percentage of GDP is still almost 16 percentage points above the level that prevailed at the end of 2019. Energy-crisis expenditures; increased defense spending and financial support programs for Ukraine and its refugees; the typical anti-cyclical spending that kicks in as business activity slows; and sharply rising interest expense all suggest a dark outlook for Europe’s aggregate fiscal position.
When monetary and fiscal policy clash
As with the pandemic emergency, the energy crisis will force policy makers to do what they must to protect their populations. Unfortunately, it comes at a time when inflation is already running rampant. Central bankers are mandated to lean hard against the rising trend in prices—even though doing so goes against their own governments’ stimulus efforts. European Central Bank (ECB) President Christine Lagarde, for example, now sounds as hawkish as Fed Chair Powell. Following the central bank’s decision to boost its three key policy rates by 75 basis points, she emphasized that rate levels are still below what most consider as neutral and are well below the peak rates needed to get inflation under control. A few more “large steps” lie ahead.
Bank of England (BOE) Governor Andrew Bailey faces an even more complicated task. Not only do inflation pressures seem more embedded in the U.K. than elsewhere, but the central bank must also navigate choppier political seas. Truss is on record saying that she plans to review the BOE’s mandate; while her comments came at a campaign rally, they have obviously resonated with the rank-and-file in the Conservative Party. Less clear is what a change in mandate might imply. Perhaps, lifting the 2% inflation target to a higher level to take some pressure off the central bank to raise rates to even more painful levels? Establishing a dual inflation and employment mandate as exists in the U.S.? Switching to a nominal GDP growth target instead of one focused solely on inflation?
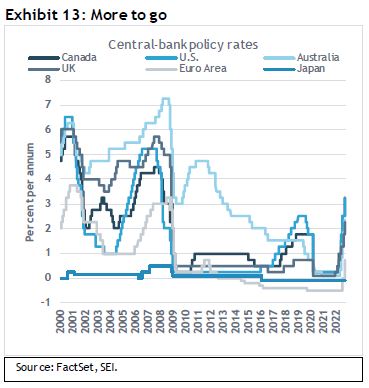
In the near term, such questions will not prevent additional increases in the BOE’s bank rate, especially since the latest tightening move has done nothing to keep the pound’s latest skid from hitting a new all-time low. The most recent 50 basis-point increase brought the bank rate to 2.25%; by comparison, the Fed’s 75 basis-point hike brought the federal-funds rate to the 3%-to-3.25% range. Given the weakness in sterling and the inflationary pressures facing the country, markets are pricing in a far steeper bank-rate hike of 100-to-150 basis points at the BOE policy next meeting in early November. During the panic at the end of the quarter, market-based estimates of the peak bank rate soared to nearly 6%, a full percentage point higher than what the U.S. futures market indicates for the federal fund rate. Exhibit 13 highlights the trajectory of policy-rate movements of the world’s major central banks.
Two-year government benchmark yields have taken another sharp leg higher as investors anticipate the additional policy rate increases that are on their way. As we show in Exhibit 14, the U.K. has leapfrogged all other countries in response to its currency crisis, vaulting more than 250 basis points in only two months’ time. Near the end of the quarter, the U.K. two-year note peaked at 4.45% before moving lower on the BOE’s emergency intervention into the market.
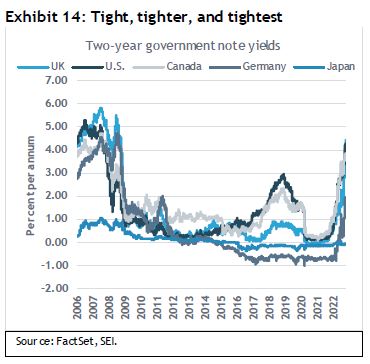
In the closing days of September, the U.S. two-year note broke through the 4% level for the first time since 2008. Canada’s two-year sovereign-note yield is following close behind. The two-year note in Germany, which was still negative as recently as March, was 1.8% at the end of September. Japan is now the only country left in the world with a negative two-year note.
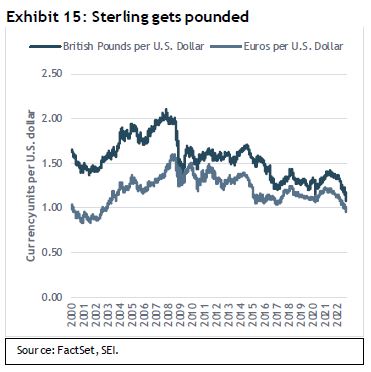
The large interest-rate differential in favour of the U.S. versus most other countries, along with the perception that the U.S. is in a better position economically, are two major reasons behind the U.S. dollar’s extraordinary appreciation over the past year. Sterling has fallen almost 17% over the past year 12 months, while the euro has depreciated 16%. Exhibit 15 on the following page shows that sterling fell past the lows hit during the pandemic-related panic of March 2020. It is now at levels against the U.S. dollar last seen in 1985. The euro, meanwhile, is trading at levels last seen in 2002.
Although a declining currency may give a competitive boost to domestic firms that export goods and services to the U.S. market, it exacerbates the inflationary pressures stemming from imports priced in U.S. dollars—most importantly, oil and liquefied natural gas.
Focusing on the U.K., the three-month moving average of non-EU import prices have soared nearly 27% over the year ended September. By contrast, import prices on goods from the EU have climbed a relatively smaller 11.4%, as shown in Exhibit 16.
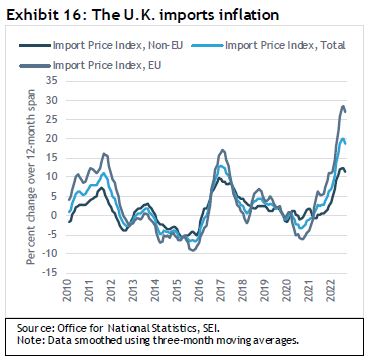
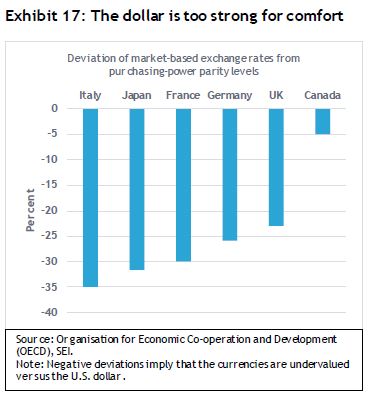
One piece of good news for the U.K. is that import-price inflation might be peaking. The bad news is that overall consumer-price inflation will likely stay uncomfortably high well into 2023, even if import-price inflation subsides. It is tempting to say that the U.S. dollar will soon peak. Several large U.S. multinational companies including IBM, Microsoft, Johnson & Johnson, PepsiCo, and Netflix have warned that the currency’s strength is beginning to exert a negative impact on their revenues, suggesting that the value of the U.S. dollar is now well beyond its purchasing-power parity level (PPP).1 Exhibit 17 highlights the deviation of market-based exchange rates of the major advanced economies versus the U.S. dollar.
All currencies listed in the chart appear undervalued—although the Canadian dollar is near its PPP equilibrium level against the U.S. dollar, mainly because Canada trades most with its southern neighbour. It also has been a major beneficiary of the commodities price boom.
Discrepancies can last for a long time between PPP and market-based exchange rates. Exhibit 18 on the following page tracks the trade-weighted exchange value of the U.S. dollar since 1973. It is easy to see that the greenback’s movements are subject to long bull and bear cycles, with ups and down proving remarkably similar in magnitude and duration.
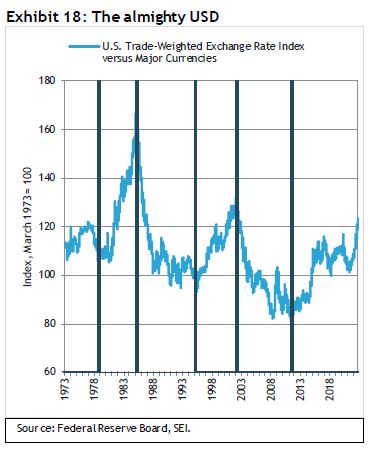
During the most recent up-cycle, now 11 years old and up 50% from its 2011 low, there have been two major declines that later reversed. The first occurred between December 2016 and February 2018 as the Trump administration ratcheted up trade tensions with China and other trading partners. The second came in March 2020 during the early months of the pandemic and extended into May 2021. More recently, the U.S. dollar pushed into new-high territory following a strong August reading of the consumer-price index and after Fed Chair Powell indicated at Jackson Hole that further interest-rate increases are on the way. (Fed rate hikes attract investment in U.S. dollar-denominated assets.)
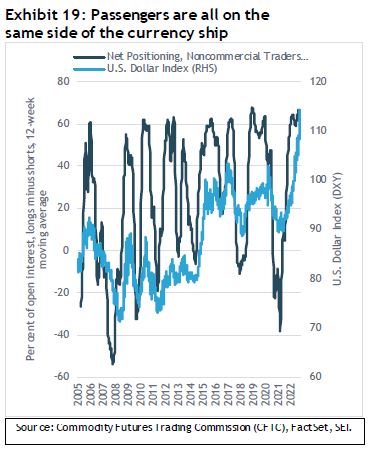
Still, it would not be surprising to see at least a temporary reversal in the U.S. currency’s trend. Exhibit 19 tracks the net positioning (longs minus shorts) of noncommercial traders (so-called speculators) in the futures and options markets. Speculators have been extremely long the U.S. dollar throughout 2022 (a profitable position) and anticipate further strength. However, we believe the currency is susceptible to an abrupt fall—perhaps triggered by a catalyst such as a coordinated government action to weaken the U.S. dollar that’s reminiscent of the Plaza Accord of 1985, for example, or a surprisingly weak U.S. employment report. Investors should remember that currency volatility is usually a two-way street.
Waiting for more things to break
Throughout 2022, market participants have consistently underestimated U.S. inflation because they have underestimated the resiliency of the U.S. economy. Growth is clearly slowing, and the economy appears on track to experience some sort of outright recession in response to the Fed’s aggressive interest-rate moves. By some measures, the U.S. economy is already stagnating. Exhibit 20 shows that purchasing managers around the world are reporting significant deceleration in growth.
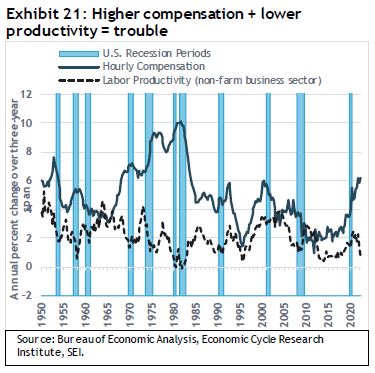
The U.S., Germany, and the euro area fell below the 50 level (more purchasing managers reporting a decline in output versus those citing an improvement) as of September. Overall business activity in the U.S. has also been looking weak, as measured by inflation-adjusted GDP, falling slightly in the first and second quarters of this year. The sluggishness in GDP has been feeding into other economic indicators, notably productivity. Even when measured over a three-year period as we do in Exhibit 21, the slowdown has been dramatic. The tight labour market may have encouraged businesses to hoard staff despite weakening demand for products and services. Also, the retirement of baby boomers (persons born between 1946-1964) means that companies are losing a large group of experienced workers.
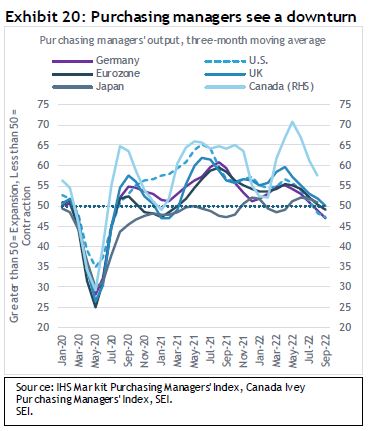
Exhibit 21 also shows the extensive rise in hourly compensation since 2018. Again measured over a three-year span, the annualized gain exceeds 6% (the sharpest increase in almost four decades). As in the 1970s, gains have been accelerating even as productivity growth has slowed. In more recent cycles, the two series have tended to rise and fall together. The recent divergence is concerning.
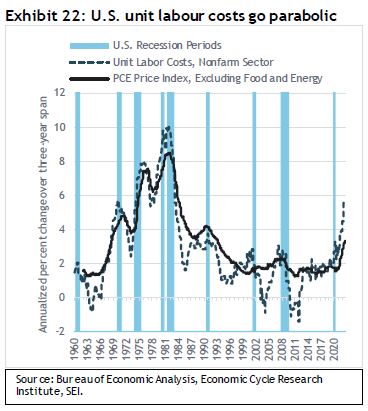
The difference between the change in compensation and the change in productivity equals the change in unit labour costs, which we view as a key component of underlying inflationary pressures. Exhibit 22 compares the three-year change in U.S. nonfarm unit labour costs against the core personal-consumption expenditures (PCE) price index, the Fed’s primary inflation measure, which the central bank targets at 2% over the course of an entire business cycle. Although unit labour costs are more volatile than inflation, there is still a strong positive correlation between the two. Unfortunately, history shows that it usually takes an outright recession to tame inflation, especially when it gets this intense. Fed Chair Powell’s hope for a soft landing appears to be an exercise in wishful thinking. Core PCE price inflation averaged 3.4% over the three years ended August—and it appears set to move above 4%, with the year-over-year rate through August having reached 4.9% and unit labour costs jumpinga stunning 9.5% as of the second quarter. We see no reason to expect a major reversal in the near term, even if the economy stumbles into a bona fide recession.
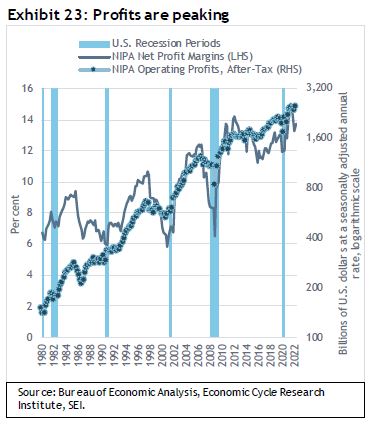
During the first half of the year, U.S. companies have been able to push their higher costs onto consumers. Exhibit 23 highlights corporate profit margins on an economy-wide basis. While down from the pandemic-recovery peak registered during the second quarter of 2021, they were still above almost all previous cyclical peaks going back to 1947. However, we believe that margins are on the cusp of a substantial erosion. It is typical for profit margins to decline well before an economic recession materializes. While the precise extent of a margin decline is impossible to predict, it often involves a peak-to-trough decline of several percentage points.
The chart also shows that cyclical peaks in profit margins coincide with peaks in after-tax operating profits. The subsequent decline may or may not be associated with an economic recession. There was no recession in the mid-1980s, for example; margins fell from a peak of 9.4% to a low of 6.4%, and operating earnings contracted by 25%. In the late 1990s all the damage was done before recession hit in 2001, with margins declining nearly five percentage points and overall profits dropping a cumulative 20% over three years. In the 2012-to-2015 period, margins fluctuated erratically from one quarter to the next, ebbing by three percentage points peak-to-trough; after-tax profits merely flattened out. On the other hand, both margins and the absolute level of profits collapsed during the global financial crisis in 2008 and in the pandemic lockdown of 2020. After-tax operating profits declined 31% over a two-year period during the global financial crisis and 18% in just two quarters during the COVID-19 lockdown period.
While akin to comparing apples with oranges, we think it is interesting that economy-wide profits, as measured in the National Income and Product Accounts (NIPA), and analysts’ estimates of forward earnings for the S&P 500 Index tend to track each other closely. To be sure, there are times when these two series disconnect. During the tech bubble of 1999 to 2000, S&P earnings estimates shot up despite the negative trend in NIPA profits. In similar fashion, GDP-based profits began to fall in the 2006 run-up to the global financial crisis—a full year before Wall Street figured out that a severe downturn was about to hit. Over the course of 2022, another gap has opened up in favour of the S&P, although it is not nearly as wide as the one that developed during the late-90s tech bubble. Nonetheless, if the economy does fall into recession and GDP-base profits begin to decline, it will probably force analysts to mark down their S&P 500 Index earnings estimates rather aggressively in order to catch up with reality.
Investors are not waiting for those downward earnings revisions. They have been pushing equities lower in reaction to the Fed’s aggressive shift to a more hawkish policy stance and in anticipation of a recession, both in the U.S. and globally. Fed Chair Powell said repeatedly during his post-decision press conference that beating inflation will involve pain. The Fed has adopted a “raise and hold” strategy—meaning it intends to hike its policy rate to a restrictive level and hold at that higher rate until inflation takes a sustained downward slide.
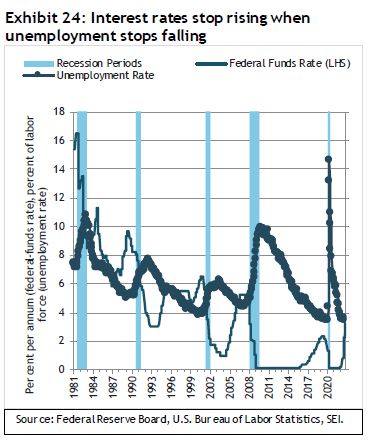
In its September projections, the FOMC called for an increase in the unemployment rate next year to 4.4% versus the current 3.7% level. Whether or not this is consistent with its forecast of modest real GDP growth in 2023 and 2024 is debatable. As we highlight in Exhibit 24 on the following page, the central bank generally stops raising its policy rate when the unemployment rate stops falling.
Soon thereafter, Fed policy pivots dramatically toward ease as it becomes clear that a recession is underway. Today, unfortunately, even as interest rates are rising, we do not yet feel the bulk of the recession or the hit to employment. This cyclical pattern is quite different from the Fed’s current game plan. One thing is clear: The Fed wants to see the labour market loosen up and wage inflation to moderate before easing its monetary stranglehold on the U.S. economy.
Fed policymakers project a federal funds rate in the 4.1%-to-4.4% range by the end of this year and 4.4%-to-4.9% next year, but the actual result may still be higher. Of course, these figures look a lot more reasonable than those provided at the end of last year. In December 2021, the median projection for the federal-funds rate was only 0.9% for 2022, 1.6% for 2023, and 2.1% for 2024.
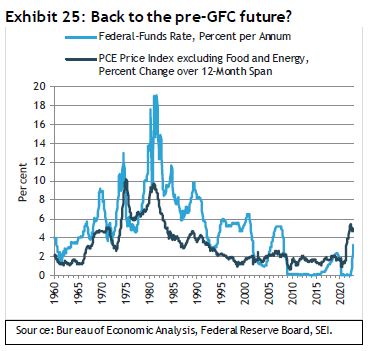
As we show in Exhibit 25, the federal funds rate historically has traded above the core inflation rate. This relationship was turned upside down during the decade following the Global Financial Crisis (GFC). We would argue that the post-COVID period has ushered in a new regime, where labour and product markets remain tight and inflation stays stubbornly above target. Unless the Fed is ready to engineer a severe recession, we think PCE price inflation could run in a 3%-to-4% range versus the sub-2% pace much of the past 25 years.
Currency, commodities, COVID, and conundrums
In our last quarterly economic outlook, we commented that investor sentiment had become pessimistic and that the selling pressure in equities had reached such intense levels that a rally could develop at any time. And it did. Between mid-June and mid-August, the S&P 500 Index posted a price rise of more than 17%, led by the consumer discretionary (+29%), information technology (+23%) and utilities (+19%) sectors. That rally did not last, with the S&P 500 Index dropping to a new cyclical low in late September. By the end of the third quarter several asset classes, including equities, bonds, currencies, and commodities, looked sharply oversold once more.
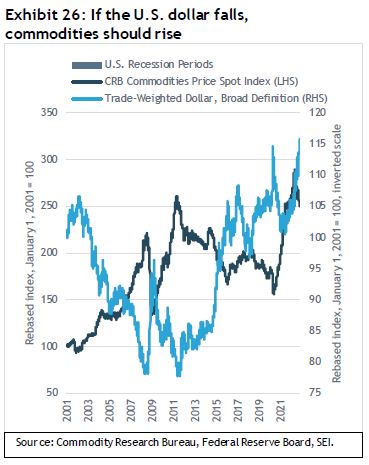
As we previously noted, the fundamental overvaluation of the U.S. dollar and the extremely long position of traders suggest that the currency also is ripe for some sort of near-term reversal. A weaker-than-expected employment report or a benign inflation result might be all that is needed. A downturn in the U.S. dollar probably would help halt the slide in commodities that picked up steam in late August. Exhibit 26 on the following page tracks the Commodity Research Bureau’s index of spot prices against the trade-weighted value of the U.S. dollar. The two series typically move in harmony in inverse fashion (when the dollar appreciates, commodity prices tend to decline). Therefore, the currency’s sharp climb has resulted in a reversal of appreciation in the commodities complex for most of this year.
We maintain a positive outlook on commodities despite the demand destruction that has occurred in Europe and other parts of the globe. Years of underinvestment in fossil fuels and metals mines will likely lead to periodic shortages over the next few years. The U.S. Strategic Petroleum Reserve (SPR), which President Joe Biden’s administration has used to deliver more than one million barrels per day of crude to the market, will see its inventory cut in half by the end of 2022 versus the year-ago period (the Biden administration recently extended the flow through November). There is a danger that inventory is now too low to deal adequately with a weather-related disruption to oil production in the Gulf of Mexico. The war in Ukraine and global drought conditions could also lead to further price spikes for agricultural products, while the shortage of fertilizer promises to keep global food production constrained.
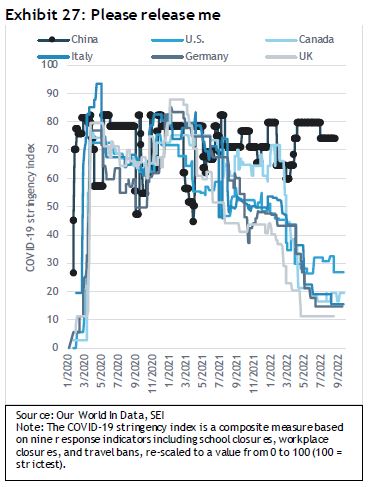
It is not just the rampaging U.S. dollar and the specter of a severe European recession that has hurt commodity pricing. The extremely sluggish growth in China this year also has had an impact. Exhibit 27 highlights how restrictive the country’s zero-COVID-19 policy is relative to the major developed countries in Europe and North America. China’s COVID-19 stringency index is as bad now as it was during the early stages of the pandemic; other countries have eased their regulations considerably. In recent weeks, the Chinese central government has allowed Hong Kong and Macau to open up. This might be a harbinger of what will happen on mainland China once the National Congress of the Chinese Communist Party installs President Xi Jinping for an unprecedented third term as its general secretary in October.
The Organisation for Economic Co-operation and Development’s leading economic index (LEI) for China, a measure of the country’s future economic activity, has posted month-to-month declines since peaking in January 2021. It fell below the 100 mark by October of that year, pointing to below-trend growth, and has subsequently dropped to a level that prevailed just before the pandemic hit the country in full force.
The LEI has been lower only twice before—during the early stages of China’s 2001 integration into the global economy, and during the 2008 global financial crisis. This may still understate the extent of the hardship currently facing the country, especially in the real estate sector.
However, even in authoritarian China there is a social compact between the people and the government. The Communist Party rules over all without question. In return, it has promised to improve the lives of its citizens. That compact worked fairly well in the 1980s and 1990s, and it was turbocharged by China’s 2001 accession to the World Trade Organization and its transformation into a global manufacturing behemoth. The compact held together in the years following the global financial crisis, although growth downshifted significantly. The government’s response to COVID-19, however, has stressed this social compact to a degree not seen since the Tiananmen Square protests of 1989. President Xi’s position may seem unassailable, but we suspect he is looking for a way out of the corner he has painted himself into with his zero-COVID-19 policy. The loosening of restrictions and the return to stronger economic growth appears to be the only logical way out.
Other emerging economies would be big beneficiaries of a revival in Chinese economic activity. However, Exhibit 28 underscores the primary importance of the U.S. dollar for investors in emerging-market equities.
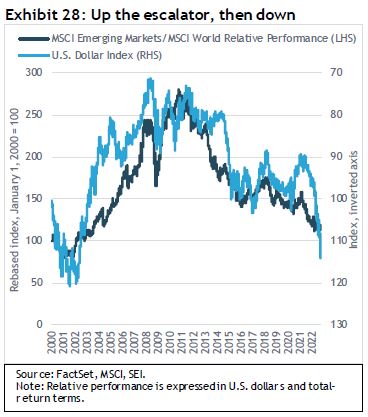
The relative performance of the MSCI Emerging Markets Index versus the MSCI World Index peaked in 2010, more-or-less concurrent with the trough in the trade-weighted value of the U.S. dollar. (Trade-weighting measures the value of the dollar versus other major currencies.) As the U.S. currency grew stronger (depicted as a falling line in the chart), emerging stock markets lagged further behind. Emerging equities have now given up almost all of their relative gains versus advanced-country stock markets achieved between 2000 and 2010.
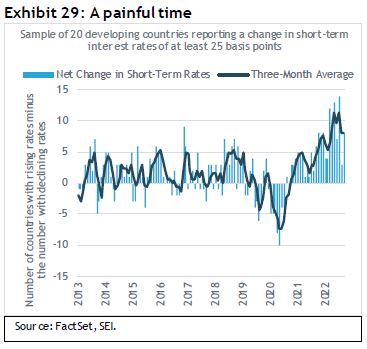
As advanced countries adopt more-restrictive monetary policies, emerging economies have no choice but to follow. As show in Exhibit 29, the rate-hiking cycle began far sooner in less-developed economies (beginning in late 2020). It was not until this year that a general up-cycle in policy rates began among the advanced economies. Interest-rate hikes in the emerging world have accelerated significantly this year in response, in both frequency and magnitude. Three-month government bonds yields were in double digits in Brazil (14.3%), Colombia (11.2%), Hungary (11.3%), and Turkey (15.6%) in September, with only Brazil’s sitting comfortably above its inflation rate. Turkey, by contrast, is facing an inflation rate of close to 80%. Little wonder that the Brazilian real has maintained its value against the U.S. dollar this year while the Turkish lira declined by almost 30%.
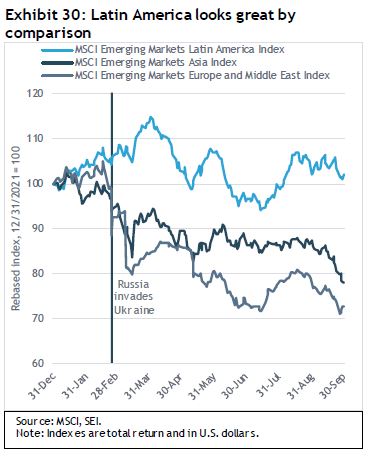
As with other risk assets, emerging-market stocks and bonds are likely to remain on the defensive until developed central banks stop raising interest rates. Latin America is the only region to post positive year-to-date equity performance (2.1%), as highlighted in Exhibit 30 on the following page. European emerging stock markets, not surprisingly, have been the weakest, posting a 27.4% decline in U.S. dollar terms.
What actions are our portfolio managers taking?
In Canadian equities, our preference for value struggled during the quarter, but remains a main driver of strong relative performance in the year-to-date period. Meanwhile, quality and energy positions outperformed in the quarter. Domestic small caps have held up well quarter to date due to sizable weights in energy and industrials. These areas still look quite cheap but bounced off their lows from June. There have been no major shifts in portfolio positioning—we still like value the most, while we have fairly neutral view on quality and momentum at this time.
In U.S. large caps, our value positioning is primarily strategic and, despite a relief rally in July that mostly benefited growth stocks, has performed well year-to-date relative to indexes and peer groups. While there are many attractively priced companies out there, we also see plenty of risks—including margin compression and credit risk, as well as periods of pain (like the one in July) when value stocks go unloved by investors. An area of the market that we believe investors are overlooking is banks and financials; they have been generating strong profits, and we view them as especially attractive given rising interest rates. Our momentum positioning is meaningfully diverse by industry and has occasionally had higher correlation with value as value stocks are showing longer-term outperformance. Quality is less expensive than it has been, but is also, in our view, less compelling than value in terms of long-term return generation. Most changes to our large-cap portfolios have been at the margins, with managers adding and trimming around the edges. Healthcare and financials remain prominent overweights, while information technology is underweight.
Within smaller U.S. companies, the momentum, quality, and value alpha sources are all attractive, in our view. However, value and quality are somewhat more expensive than they were to start the year given their strong performance. The small-cap portfolios remain defensively positioned with an overweight to quality and less risk than the market in terms of beta. In our view, there has been a significant amount of bad news priced into small caps. Given this, we expect to begin reducing the overweight to defensive stocks in favour of cyclicals. In general, small-cap earnings have held up well—especially for consumer and leisure stocks—but we are concerned about whether this trend can continue.
International equity markets are another area of concern—especially the U.K. and Europe, with high inflation, Russia’s war in Ukraine, natural-gas supply shortages, evolving central-bank policies, and a changing political landscape. Despite the obstacles, European banks appear more attractive due to their cheapness. Pharmaceuticals within healthcare also look attractive. From a positioning perspective, we are looking to add more value exposure as our higher value exposure has proven beneficial due to elevated dispersions. From a quality perspective, the U.S. generally appears more attractive than most other regions while Europe, Australasia, and the Far East quality are not as attractive.
Emerging markets are facing a number of headwinds. Although there are signs that China’s response to COVID-19 may be easing, the government has continued to enforce strict lockdowns; the country’s real estate market is also of concern. High global inflation and the subsequent interest-rate hikes global central banks are making to combat it are impediments to global growth—particularly in emerging markets. The Fed’s aggressive rate hike has resulted in a stronger U.S. dollar and contributed to capital outflows for emerging markets. In Latin America, a region with numerous energy exporters, expectations for commodity prices drive the story. We still think value is attractive. Quality is not cheap but is no longer as expensive it was a year ago owing to a price correction. Momentum has shifted more to financials and commodities; it is not as expensive as it was two years ago.
As should be expected, low-volatility stocks failed to keep pace with the growth-oriented relief rally in July. Still, low volatility has helped significantly to mitigate year-to-date losses for investors. Like other areas of the market, value remains attractive. It also helps to offset some of the other risks associated with a low-volatility strategy, such as duration (interest rate) risk.
In factor-based portfolios, diversification worked and should continue to do so as mega-cap stocks lagged. Diversification has been a tailwind to actively managed strategies. Value remains attractive given its defensive attributes although it remains exposed to consumer and inflation risks. Quality is less attractive, but inflation has not yet hit earnings—we are less constructive on quality as it generally underperforms in rising-rate environments. Our positioning favours momentum on the margin; it distinguishes between inflation winners and losers. Value performance was marginally negative for the quarter and strong for the year to date. Communication services and industrials have underperformed in the three-month period, while utilities, energy, and financials outperformed. Growth is a major laggard year to date. Managed- and low-volatility strategies performed well year to date. Value is becoming increasingly defensive, while momentum is more diverse and less exposed to growth.
Fixed income remains focused on the BoC. Currently, the bank’s policy rate stands at 3.25%, but with two meetings left before the end of the year, expectations are for two more rate hikes totaling 0.75% to bring the terminal rate to 4.0%. The Canadian yield curve has continued to invert and it’s a significant inversion. Even though the BoC has forcefully increased rates, it has not been as aggressive as the Fed. Although there were no material changes in portfolio positioning, we would note that spread duration moved from neutral to slightly underweight due to changes made by PIMCO. We remain underweight government and provincial bonds, and overweight corporate bonds (financials). We are out-yielding the index and outperforming on a year-to-date basis.
The high-yield market has held up relatively well, benefitting from the performance of energy and floating-rate securities. However, the new-issuance market had only $15 billion coming to market for the third quarter (as of this writing). Fund flows have been negative as well, totaling about $4 billion this quarter. Default rates remain historically low at 1.5%. Moody’s expects defaults to increase slowly to an August 2023 peak of 4.5%, approximately amounting to the average rates over the past 5 and 10 years. In terms of credit rating, we preferred B and CCC rated bonds to higher rated BB bonds. Our portfolios were overweight basic industry on relative values; underweight telecommunications and services; and short duration given the rising-rate environment. Our outlook has not changed, with our primary concerns still being interest rates, inflation, possible recession, and geopolitical tensions. As such, there were no material changes in portfolio construction.
Our emerging-markets debt strategies continued to overweight high-yield and hard-currency debt. This positioning largely drove performance for the quarter. We remained roughly neutral to the U.S. dollar and were marginally short U.S. dollar-denominated bonds.
Our view: Don’t panic when markets are manic
The list of economic, geopolitical, and pandemic-related concerns is certainly long. Market volatility has been high throughout 2022, and it appears unlikely to change as we enter the final quarter of the year. Investors may be nervous or even fearful about what this means for their investment goals, but making major portfolio decisions with such a mindset only creates additional risks. To that end, we think the best thing an investor can do in a manic market is remember to not panic—and remain calm, diversified, and committed to their long-term plans.
We believe that active investment managers are well positioned to do this and, therefore, should fare better during these tumultuous times. Likewise, broadly diversified portfolios should perform relatively better overall than portfolios that are highly concentrated.
Glossary
Bull market refers to a market environment in which prices are generally rising (or are expected to do so) and investor confidence is high.
Cyclical stocks or sectors are those whose performance is closely tied to the economic environment and business cycle. Managers with a pro-cyclical market view tend to favour stocks that are more sensitive to movements in the broad market and therefore tend to have more volatile performance.
Federal funds rate is the interest rate charged to lending institutions on unsecured overnight loans. It is set by the Federal Reserve’s Federal Open Market Committee. The rate is increased when the Federal Reserve wants to discourage borrowing and slow the economy and decreased when the Federal Reserve wants to spur economic growth.
Growth stocks exhibit steady earnings growth above that of the broader market.
High-yield bonds are rated below investment grade and are considered to be riskier.
Issuance is the sale of securities, typically with regard to debt instruments such as bills, notes, and bonds.
Value stocks are those that are considered to be cheap and are trading for less than they are worth.
Yield curves represent differences in yields across a range of maturities of bonds of the same issuer or credit rating (likelihood of default). A steeper yield curve represents a greater difference between the yields. A flatter curve indicates that yields are closer together.
Glossary of Alpha Sources Definitions:
Alpha source: Alpha source is a term used by SEI as part of our internal classification system to categorize and evaluate investment managers in order to build diversified fund portfolios. An alpha source is the investment approach taken by an active investment manager in an effort to generate excess returns. Another way to define an alpha source is that it is the inefficiency that an active investment manager seeks to exploit in order to add value.
Momentum: A trend-following investment strategy that is based on acquiring assets with recent improvement in their price, earnings, or other relevant fundamentals.
Quality: A long-term buy and hold strategy that is based on acquiring assets with superior and stable profitability with high barriers of entry.
Security selection: An investment strategy that employs research and judgement to uncover individual opportunities that have been mispriced by other financial market participants.
Value: A mean-reverting investment strategy that is based on acquiring assets at a discount to their fair valuation.
Index definitions
The Broad Trade-Weight Dollar Index (also called the trade-weighted U.S. dollar index or the broad index) is a measure of the value of the U.S. dollar relative to other world currencies.
The Commodity Research Bureau’s Spot Index tracks 22 commodities presumed to be among the first influenced by changes in economic conditions.
The Core Personal Consumption Expenditure Price Index (which excludes energyand food), is the Federal Reserve’s (Fed) preferred measure of inflation.
The Consumer Price Index measures changes in the price level of a weighted-average market basket of consumer goods and services purchasedby households. A consumer-price index is a statistical estimate constructed using the prices of a sample of representative items whose prices are collected periodically.
The COVID-19 Stringency Index is a composite based on nine indicators including school closures, workplace closures, and travel bans. A score of 1 is the least restrictive status.
Composite Index of Leading Indicators (U.S. Conference Board) (U.S. Conference Board) is used to help predict the overall condition of the U.S. Economy.
The MSCI Emerging Markets Asia Index is composed of large- and mid-cap stocks representing approximately 85% of the free float-adjusted market capitalization of China, India, Indonesia, Korea, Malaysia, the Philippines, Taiwan and Thailand.
The MSCI Emerging Markets Europe and Middle East Index is composed of large- and mid-cap stocks representing approximately 85% of the free float-adjusted market capitalization of the Czech Republic, Greece, Kuwait, Hungary, Poland, Qatar, Turkey and United Arab Emirates.
The MSCI Emerging Markets Index is a free float-adjusted market-capitalization-weighted index designed to measure the performance of global emerging-market equities.
The MSCI World Index is a free float-adjusted market-capitalization-weighted index that is designed to measure the equity-market performance of developed markets.
The Personal Consumption Expenditures (PCE) Price Index is the primary inflation index used by the Federal Reserve when making monetary-policy decisions.
The Purchasing Managers’ Index is an indicator of economic health for manufacturing and service sectors. Its purpose is to provide information about current business conditions to company decision makers, analysts and purchasing managers.
The S&P 500 Index is an unmanaged, market-weighted index that consists of 500 of the largest publicly traded U.S. companies and is considered representative of the broad U.S. stock market.
The US Dollar Index measures the value of the U.S. dollar (USD) against a weighted basket of currencies used by US trading partners. It rises when the dollar strengthens against these currencies and falls when it weakens.
Important Information
SEI Investments Canada Company, a wholly owned subsidiary of SEI Investments Company, is the Manager of the SEI Funds in Canada.
The information contained herein is for general and educational information purposes only and is not intended to constitute legal, tax, accounting, securities, research or investment advice regarding the Funds or any security in particular, nor an opinion regarding the appropriateness of any investment. This commentary has been provided by SEI Investments Management Corporation (“SIMC”), a U.S. affiliate of SEI Investments Canada Company. SIMC is not registered in any capacity with any Canadian regulator, nor is the author, and the information contained herein is for general information purposes only and is not intended to constitute legal, tax, accounting, securities, or investment advice, nor an opinion regarding the appropriateness of any investment. You should not act or rely on the information contained herein without obtaining specific legal, tax, accounting and investment advice from qualified professionals. This information should not be construed as a recommendation to purchase or sell a security, derivative or futures contract. You should not act or rely on the information contained herein without obtaining specific legal, tax, accounting and investment advice from an investment professional. This material represents an assessment of the market environment at a specific point in time and is not intended to be a forecast of future events, or a guarantee of future results. There is no assurance as of the date of this material that the securities mentioned remain in or out of the SEI Funds.
This material may contain "forward-looking information" ("FLI") as such term is defined under applicable Canadian securities laws. FLI is disclosure regarding possible events, conditions or results of operations that is based on assumptions about future economic conditions and courses of action. FLI is subject to a variety of risks, uncertainties and other factors that could cause actual results to differ materially from expectations as expressed or implied in this material. FLI reflects current expectations with respect to current events and is not a guarantee of future performance. Any FLI that may be included or incorporated by reference in this material is presented solely for the purpose of conveying current anticipated expectations and may not be appropriate for any other purposes.
There are risks involved with investing, including loss of principal. Diversification may not protect against market risk. There may be other holdings which are not discussed that may have additional specific risks. In addition to the normal risks associated with investing, international investments may involve risk of capital loss from unfavourable fluctuation in currency values, from differences in generally accepted accounting principles or from economic or political instability in other nations. Emerging markets involve heightened risks related to the same factors, in addition to those associated with their relatively small size and lesser liquidity. Bonds and bond funds will decrease in value as interest rates rise.
SIMC develops forward-looking, long-term capital market assumptions for risk, return, and correlations for a variety of global asset classes, interest rates, and inflation. These assumptions are created using a combination of historical analysis, current market environment assessment and by applying our own judgment. In certain cases, alpha and tracking error estimates for a particular asset class are also factored into the assumptions. We believe this approach is less biased than using pure historical data, which is often biased by a particular time period or event.
The asset class assumptions are aggregated into a diversified portfolio, so that each portfolio can then be simulated through time using a monte-carlo simulation approach. This approach enables us to develop scenarios across a wide variety of market environments so that we can educate our clients with regard to the potential impact of market variability over time. Ultimately, the value of these assumptions is not in their accuracy as point estimates, but in their ability to capture relevant relationships and changes in those relationships as a function of economic and market influences.
The projections or other scenarios in this presentation are purely hypothetical and do not represent all possible outcomes. They do not reflect actual investment results and are not guarantees of future results. All opinions and estimates provided herein, including forecast of returns, reflect our judgment on the date of this report and are subject to change without notice. These opinions and analyses involve a number of assumptions which may not prove valid.
Information contained herein that is based on external sources is believed to be reliable, but is not guaranteed by SEI Investments Canada Company, and the information may be incomplete or may change without notice.
Commissions, trailing commissions, management fees and expenses all may be associated with mutual fund investments. Please read the prospectus before investing. Mutual funds are not guaranteed, their values change frequently and past performance may not be repeated.


