Economic Outlook: O Canada! Economy Waiting for the Better Day
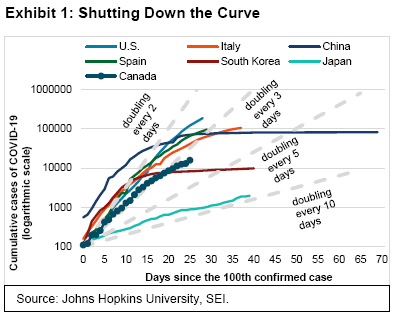
Like the rest of the world, Canada is facing a sharp fall in economic activity as it tries to control the spread of the highly contagious novel coronavirus, which causes the disease COVID-19. Exhibit 1 shows that the number of infections in the country (the dark blue line with the round markings) already approached 16,000 as of April 5. Canada’s infection curve has not been quite as steep as that of some other countries in the chart, but the number of cases is still doubling every three days. The country has had no choice but to engage in the same social distancing measures as those implemented in the U.S. and in Europe—including the shutdown of non-essential businesses.
Unfortunately, Canada’s economy was already limping along before its least-necessary businesses were forced to shutter their doors. Even without the impact of the virus and the onset of the Saudi-Russian oil-price war, the country might have finished the first quarter with a slightly negative inflation-adjusted gross domestic product (GDP) as it faced several challenges: a decline in trade with China (which went into lockdown in February), severe winter weather, rail blockades, and a teachers’ strike in Ontario. We expect Canada’s GDP in the second quarter to be deeply in the red.
Like the U.S., monetary and fiscal policy measures have been quickly put into place, although the extent of the liquidity and stimulus injections appear to be less aggressive than those implemented south of the border. The Bank of Canada (BoC) cut its policy rate to 0.25% from 0.75% on March 27. The central bank also launched two new programs, one to ease the liquidity strains in various parts of the credit market, and the other a quantitative-easing (QE) program that will purchase government debt in the secondary market. Although the BoC QE program does not appear to be as open-ended as the one pursued by the U.S., the central bank says it is ready to do whatever it takes to alleviate the crisis.
Canada’s fiscal-policy response also appears much less extreme than the approach taken by the U.S. It includes C$55 billion of tax deferrals in order to enhance the short-term liquidity of households and businesses and C$27 billion of direct support. The various measures in the emergency fiscal package adds up to about 3.5% of GDP, much less than the recently passed U.S. fiscal program that totals more than 10% of its GDP.
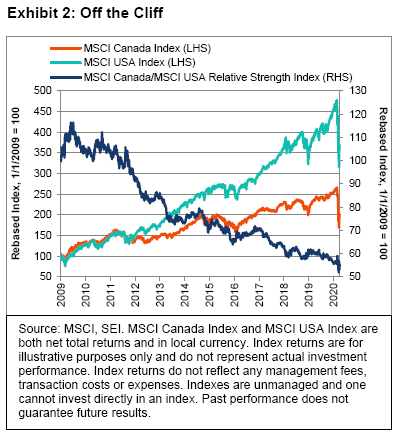
Exhibit 2 shows performance of the MSCI Canada and MSCI USA Indexes in local currency terms. Both indexes plunged in the past month or so, and rebounded some toward the end of the quarter. Investors across the two markets endured about the same amount of pain during in the first quarter—with Canadian equities down 20.28% and U.S. equities down 19.65% (both net, total returns). However, an extended timeline reveals that Canadian equities have been in a long relative downtrend versus the U.S.
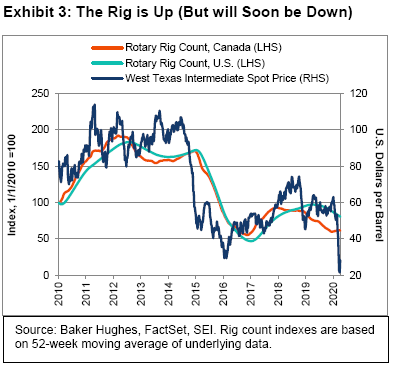
The collapse in oil prices is another blow to the Canadian economy, although the pre-occupation with the outbreak-turned-pandemic has buried this story on the back pages. West Texas Intermediate (WTI) oil prices (WTI) decreased from $61.06 to $20.48 per barrel in the three-month period ending March 31; in Alberta, Western Canadian Select crude oil dropped to about $5 per barrel by the end of the quarter since the oil could not find an outlet. The price collapse in WTI amounted to 66%—matching the percentage drop sustained by Canadian small-cap energy companies for the quarter. Although Alberta’s economy is expected to be most impacted by the oil-price collapse, the rest of Canada will undoubtedly also suffer. We have seen the price of crude rebound somewhat since the end of the first quarter, but it remains far below where it was prior to the start of the Saudi-Russian oil-price war and virus-related shutdowns of many economies. The price is well under the cost of production for many energy companies. We anticipate a number of bankruptcies and consolidations in the oil patch if prices do not bounce significantly higher in the coming months. Exhibit 3 shows that the number of rigs operating in Canada and the U.S. have followed oil prices with a lag.
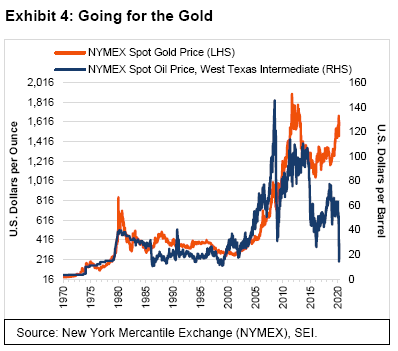
While oil prices have been heading south, gold has been one of the best-performing asset classes this year, rising 14.9% in Canadian dollars and 3.8% in U.S. dollars through March 31. Exhibit 4 highlights the recent sharp price divergence between oil and gold. So far this year, despite the price climb in the price of the yellow metal, gold companies returned a negative 10.4% on the S&P/TSX Composite Index and a negative 28.6% on the S&P/TSX SmallCap Index, so far this year. While outperforming their respective broad-market benchmarks, gold companies were significantly behind bullion. This goes to show that gold companies are not necessarily a good proxy for gold bullion.
Feeling sick: Markets take black swan dive
According to the Chinese zodiac, 2020 is the Year of the Rat. Given the recent turmoil in global financial markets, this seems fitting, as 2008 was the last Year of the Rat (when the global financial crisis arrived). That said, if we could assign our own zodiac animals, we would call 2020 (and 2008, for that matter) the Year of the Black Swan. Black swans, once largely presumed a myth because only the white variety was ever observed in nature, have become symbols of events that are exceptionally rare in occurrence and severe in impact. The 2008 black swan came in the form of the real-estate crisis and the collapse of U.S. investment institution Lehman Brothers. Today we are confronted with a black swan in the form of a pandemic, as the coronavirus disease (COVID-19) continues its rapid spread and causes financial markets to plunge across much of the world.
Since the newly discovered virus began to spread from China early this year, many countries and regions have recorded sharp equity-market declines of more than 30% from their most recent highs—far exceeding the minimum 10% decline that defines a stock market correction. The total-return performance of the MSCI USA Index, MSCI World ex-USA Index and MSCI Emerging Markets Index on a year-to-date, one-year and peak-to-trough basis through March 31 provides a broad assessment of the damage to equity markets, as shown in Exhibit 5.
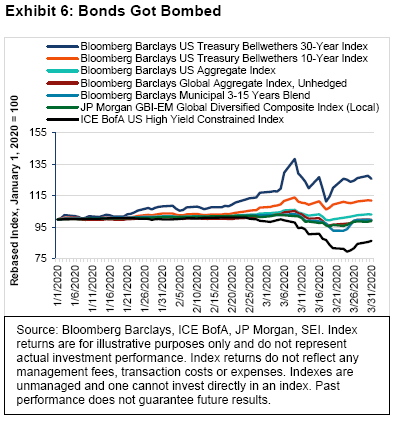
Trading in the bond market has been chaotic at times, bringing back bad memories of the 2008 Year of the Black Swan. Sovereign bond prices have mostly soared and yields have hit record lows in the year to date, as investors turn to the perceived security of debt issued by national governments (yields and prices move inversely). Credit spreads have widened dramatically, however, as investors seek traditionally safer assets like cash and short-term government bonds.
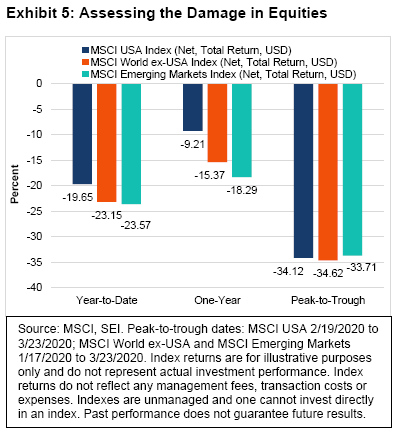
Exhibit 6 highlights the year-to-date total-return changes in a variety of fixed-income benchmarks. Only U.S. Treasury bonds finished the quarter above their end-of-February levels. Fortunately, heavy intervention by the U.S. Federal Reserve (Fed) seems to have curbed some of the panic and disorderly trading in credit markets, leading to price recoveries off more recent extreme lows.
Underlying all this dysfunctional trading are the daily COVID-19 status reports. Exhibits 7 and 8 display the same data—the progression of new cases within the most affected countries (according to the Johns Hopkins dashboard1)—but present the data in different ways. Exhibit 7 tracks the rate of new infections within each country since January 22 this year.
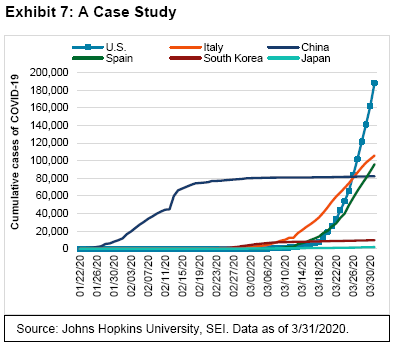
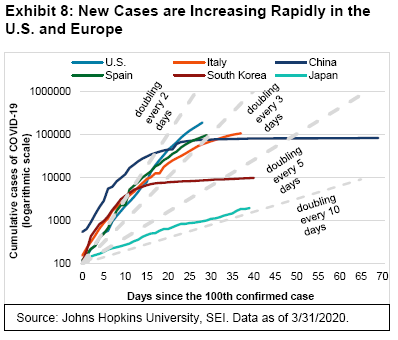
Exhibit 8 looks at the same countries, but compares their rates of infection from the day after reaching 100 confirmed cases (much like Exhibit 1). Exhibit 8 is on a logarithmic scale, so that a steady percentage rate of gain can be tracked as a straight line instead of an exponential curve.
China was the first country to get into trouble and appears to be the first to have gotten out. Its confirmed cases began to ramp up in late January, increasing rapidly into the middle of February. The growth rate then flattened over the next two weeks; few new cases have been reported since the beginning of March, most of which were apparently “imported” via Chinese nationals returning from trips abroad (especially students coming back from institutions in the U.K. and U.S.). While China has been heavily criticized for its slow initial response and lack of transparency, its aggressive lockdown of Wuhan (the city where the new virus was discovered) and greater Hubei province seems to have successfully limited the spread of COVID-19 across the rest of the country.
Reports of the Chinese government closing down temporary hospital-overflow sites are certainly a sign that officials there believe the virus is close to running its course in the country. Even Hubei province is coming back to normal operations. SEI personnel based in Hong Kong confirm that the country is slowly reviving economically. Shenzhen and Shanghai are back up to about 80% of normal production according to the American Chamber of Commerce, although other major cities are lagging that pace. That noted, China’s government is also showing signs that it remains fearful that the virus could make a comeback—for example, it has closed theaters once again to limit the risk of transmission.
Outside China, South Korea’s much milder sickness curve can be credited to a close public-private partnership approach and an emergency plan for handling pandemics that was established after the 2003 SARS epidemic. The country’s aggressive approach, includes tracking down and testing those who may have been exposed and isolating them. Although the number of confirmed cases in South Korea is still rising, it is doing so at a dramatically slowing rate.
The epicenter of the disease is now in Europe and the U.S. Both geographies are recording a ramp-up in infections as the virus spreads and more tests become available. A test-kit shortage remains severe, suggesting that actual cases are higher than the reported number. Even so, the U.S. now has the greatest number of confirmed cases, and the count is growing rapidly.
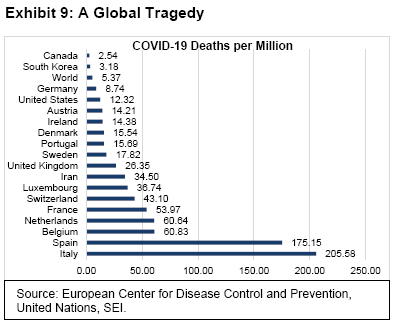
In Europe, Italy and Spain have suffered most in terms of number of cases and deaths. Both have locked down their economies to a notable extent, with other European countries being forced to adopt similar measures as their respective infection rates accelerate. Many are reporting a doubling of cases every five to seven days as of the end of March, including the U.K., Germany, France and the Netherlands. Meanwhile, Italy has now lost more lives to COVID-19 than China because of failure to act quickly enough to force the isolation of its citizens. Exacerbating the vulnerability of Italy is that it has the second oldest population2 of any country, with multiple generations living in the same household, putting the already high-risk elderly at greater risk of exposure. The country’s healthcare system has been overwhelmed, forcing doctors to triage. Exhibit 9 measures the number of coronavirus-related deaths per one million people in a number of countries around the world.
Italy’s mortality rate at the end of March is far greater than that of any other country, while Spain also lost significantly more people relative to other areas. Both are still seeing a rapid rise in new confirmed cases.
At this point, the goal of every government is to have an experience that is closer to that of South Korea than Italy. The only way to achieve that outcome is through implementing tough measures to keep people away from each other. In the U.S., the exponential spread of the virus has necessitated a major shutdown of economic activity in a growing number of states, including New York, New Jersey, Pennsylvania, Illinois, California and Washington. The ultimate impact on U.S. GDP is truly anybody’s guess. The first quarter of 2020 could see a decline at an annual rate of between 3% and 5%. The second quarter will likely be one for the record books. As of this writing, forecasts continue to move significantly lower, in some cases exceeding an annualized rate of 30%. This sudden and widespread stop in economic activity by government fiat is something that has never before been experienced on such a scale. And it comes at a time when the U.S. economy, indeed the global economy, appeared to be on an upswing.
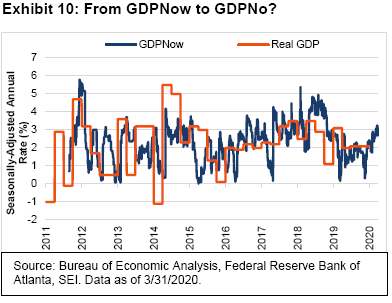
In Exhibit 10, we replicate a statistic that the Federal Reserve Bank of Atlanta publishes and calls GDPNow. It is a running estimate of real (inflation adjusted) GDP based on available data for the current quarter, using a methodology that is similar to the one the Bureau of Economic Analysis uses in its computation of GDP. The GDPNow statistic is not a forecast; rather, it is an estimate of how actual GDP is evolving on a daily basis through the quarter as new data become available. GDPNow indicated as late as March 26 that overall business activity was running at a 3.1% seasonally-adjusted annual rate.
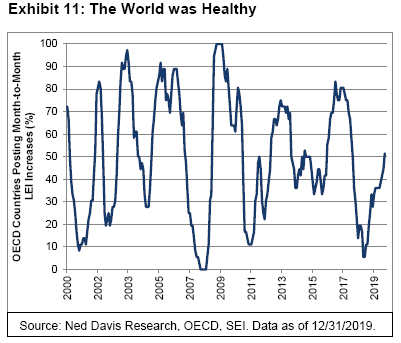
Before the virus upended China at the end of last year, leading economic indicators (LEI) of many countries were recovering from their 2019 lows. Exhibit 11 shows that more than 50% of the countries tracked by the Organisation for Economic Co-operation and Development (OECD) were logging month-over-month increases in their composite LEI in December. This statistic will likely turn abruptly lower as we get to the February-to-March data. We expect all countries will soon be reporting declines, perhaps as soon as April.
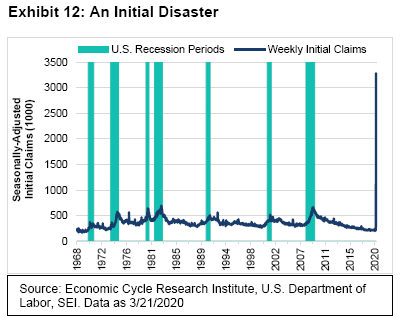
Outside of China, there are relatively few data points showing how quickly the global economy is deteriorating. In the U.S., however, there is one statistical series that already provides a stunning view of what likely lies ahead. Exhibit 12 highlights a historic rise in weekly initial unemployment claims—soaring to a seasonally adjusted 3.28 million in the week ending March 21 (actual claims were 2.9 million), and shattering the previous all-time high of 695,000 recorded in the week ended October 1, 1982. This number is expected to get far worse.
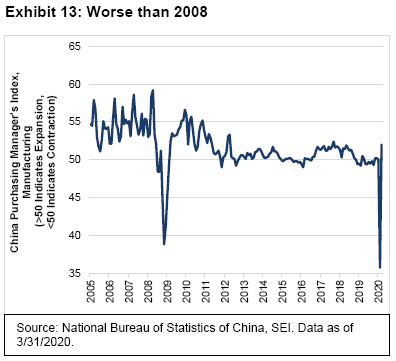
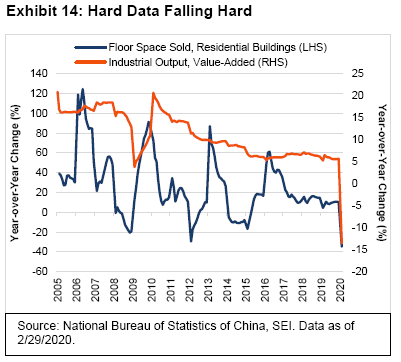
The data from China provide additional clues about the future. Exhibit 13 tracks the country’s purchasing managers’ index (PMI) for the manufacturing sector. In February, the PMI took a black swan dive, if you will—from the 50 level (indicating a stable manufacturing environment) to a lower point than ever seen during the worst month of the 2008 global financial crisis. Exhibit 14 illustrates some of the “hard data” (that is, not measured by sentiment) that also signal a sharp deterioration in China’s economy. The country’s overall industrial output fell by 13.5% year over year in February, while its home sales plunged by 35% in the same period. Although the PMI rebounded sharply in March, keep in mind that this indicator doesn’t measure actual activity; it only tracks the net percentage of survey participants reporting an improvement in business conditions.
China now appears to be recovering, but the ramp-up has been slow. The steep decline in demand for China’s goods in the months immediately ahead, especially from Europe and the U.S., may hold back China’s rebound. However, we expect internal consumption will rise smartly. One piece of good news: Retailers Apple and Starbucks are reopening their stores in China, even as they close them elsewhere in the world.
Bringing out the big guns
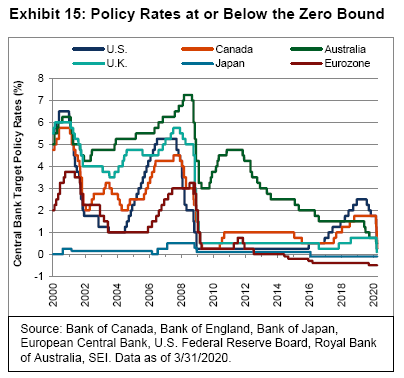
As shelter-in-place and lockdown orders ripple across the U.S. and other countries, national governments have been quick to respond. All central banks are in crisis-fighting mode, having learned valuable lessons during the 2008-to-2009 global financial crisis. Exhibit 15 highlights the sharp drop in key lending rates over the past month. While policy rates in the eurozone and Japan remain in negative territory, those of other major economies have been slashed to zero, or are in the process of heading there. Most emerging-market central banks are cutting rates as well.
Aggressive interest-rate cuts, however, are the least of what central banks are doing to help support their domestic economies. Major central banks are dusting off their respective global financial-crisis handbooks, re-establishing unconventional bond-buying programs and creating some new facilities to expand the types of accepted collateral in order to extend cash to companies that need it. The Fed, for example, committed to purchasing unlimited amounts of U.S. Treasurys and mortgage-backed securities. The U.S. central bank also is relaunching several facilities established in 2008, including its Commercial Paper Funding Facility to purchase highly-rated three-month commercial paper; its Primary Dealer Credit Facility to limit the stress on broker-dealers; and its Term Asset-Backed Loan Facility (TALF) to enable the issuance of asset-backed securities (ABS) backed by student loans, auto loans, credit card loans, and loans guaranteed by the U.S. Small Business Administration as well as certain other assets. The central bank also is extending support to money markets and pledged to buy, for the first time, corporate securities in both the secondary and primary markets as well as municipal debt in order to ease the liquidity crunch in those markets.
In the U.K., the Bank of England (BoE) cut the official bank rate to 0.1%, the lowest ever in the 326-year history of the lending rate. In a speech made earlier this year,3 former BoE Governor Mark Carney said that a £60 billion increase in asset purchases “would deliver the equivalent of around a 100 basis point cut to Bank Rate.” The latest action is more than three times that. The central bank has announced a £200 billion asset-purchase program, mostly of government bonds. That amounts to some 9% of U.K. GDP, and will be conducted at a monthly pace that eclipses previous rounds of quantitative easing (including the one in 2009).
Other actions taken by the BoE include an enhancement to the Term Funding Scheme that could double the program’s size to £200 billion and provide additional incentives for banks to lend to small- and medium-sized enterprises. Finally, the central bank established a Commercial Paper Facility with no cap limit to be financed by central bank reserves.
Meanwhile, the European Central Bank (ECB) announced a new quantitative-easing (QE) package called The Pandemic Emergency Purchase Program that amounts to €750 billion, which should bring total QE-related asset purchases to more than €1.1 trillion (over 9% of eurozone GDP) in 2020. The central bank finally decided to alter its self-imposed constraints such as issuer limits on the amounts and types of securities it can buy. It has plenty of firepower in reserve in the form of its Outright Monetary Transactions program, a lending facility that can purchase an unlimited amount of short-term government bonds.
In our view, the general thrust of monetary policy is the same around the globe: Act as the lender of last (if not first) resort, not just to the banking system but to the economy as a whole. As governments ramp up their fiscal policy responses, central banks appear ready and willing to step up and absorb the massive issuance of debt expected to cascade into the marketplace. Modern Monetary Theory—the idea that governments can print an unlimited amount of money without regard to revenue—is being put to a real-world test.
No Longer Fiddling while Rome (and many other cities) Burn
The Fed and other leading central banks have moved with an alacrity and forcefulness that we find commendable. However, central banks cannot single-handedly support their economies when those very economies are shutting down to slow the spread of COVID-19. In our view, fiscal policy—in the form of direct income support, tax deferrals, loan guarantees and outright bailouts of industries badly damaged by the almost-complete halt of economic activity—must be the prime policy tool used to conduct this war.
Governments, however, tend to move slowly. Divided governments like that of the U.S. can be particularly slow to react, even in the face of dire conditions. Nonetheless, the fiscal response is occurring with a speed and decisiveness that has seldom been seen. The U.S. Congress passed into law a $2.6 trillion program of direct rebates to households and individuals; tax deferrals and enhanced tax breaks for corporations; forgivable loans and loan guarantees for small businesses; direct assistance to the hardest hit industries; enhanced unemployment benefits; and direct assistance to state and local governments (where finances are being strained to the breaking point by the loss of revenue and the immense expense of fighting the virus). The total fiscal response, including the smaller spending packages in previous packages, should top 10% of GDP—meaning that the overall government deficit this year in the U.S. could approach 15% of GDP. Even before the ink dried on the latest package, there already is talk of the need for another funding package for states and local governments.
Other developed countries are looking to pursue a similar strategy of massive income support and liquidity injections. Germany, a country that typically keeps its wallet closed, is setting the example for Europe. The government has proposed a €1 trillion package, equivalent to a whopping 30% of the country’s GDP, counting contingencies. It includes loan guarantees for both large and small businesses that could cover as much as two-thirds of non-financial firms’ existing loans. The package also includes a rescue fund that can inject as much as €100 billion into firms judged to be of economic significance to ensure their solvency. Income-support programs for the self-employed are yet another feature of the bill. Since Germany has built up large reserves in its existing income-support program, the supplementary budget is expected to push the country’s on-budget deficit only toward 5% of GDP in 2020, following several years of surplus. The government, however, still intends to issue debt in the amount equivalent to 10% of GDP.
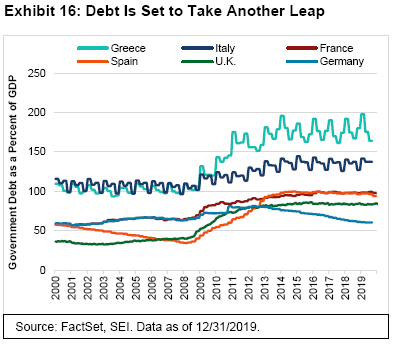
Few other countries in Europe have the fiscal strength of Germany. Italy, the European epicenter of the virus, will be particularly hard-pressed to do all that is needed to stabilize its economy. As Exhibit 16 shows, Italy’s government debt-to-GDP ratio is already well above other major European countries (although it remains far under the debt burden of Greece). The only way a financial crisis can be averted is through the ECB backing up the debt. This is now-or-never time for the EU and eurozone. The stronger countries must come to the aid of the weaker, or face an intensified popular backlash that could threaten the unity of the economic zone. Unfortunately, Germany and the Netherlands are not yet ready to come to the rescue and are standing in the way of the EU issuing ”corona bonds.” We anticipate this opposition will melt in front of the unfolding disaster.
The incredible volatility exhibited by both stocks and bonds indicates that investors have had a tough time pricing the uncertainty that has enveloped the global economy. The onslaught of developments presented by the spread of the virus and a simultaneous collapse in oil prices has forced financial markets to recalibrate prices sharply as expectations about different industries and the overall economy shift at a breakneck pace. Investors should gain some reassurance, however, from the fact that a virus-containment-induced earnings recession is generally only expected to last a couple quarters or so. If market prices are based on a long-term, multi-year expectation, then this fallout should represent a relatively small part of the market’s forward-looking focus.
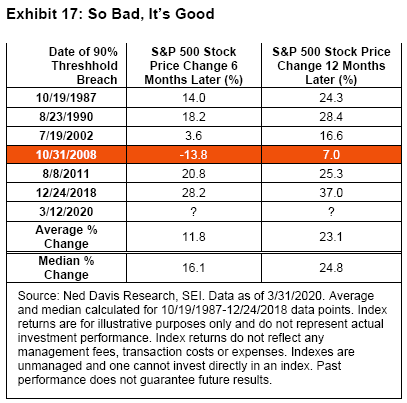
In any event, there is no question that markets have entered deeply oversold territory. Regular readers of the Quarterly Economic Outlook may be familiar with the table in Exhibit 17. It looks at what happens when more than 90% of large-cap stocks fall below their 200-day moving averages. Daily history, provided by Ned Davis Research, goes back to 1981. Over that 39-year period, there have been only six occasions before this year when the 90% threshold was breached. The last time was on Christmas Eve in 2018. We were confident at that time that the stock market would recover strongly from its fourth-quarter 2018 swoon. The economy was in good shape and the odds of an economic recession were low. Today’s economic backdrop is quite different.
The table in Exhibit 17 highlights the one occasion when stock prices were lower six months after the 90% threshold was breached. It happened during the global financial crisis: The threshold was breached in October in the wake of Lehman Brothers’ collapse. Six months later, the S&P 500 Index (price-only) was 13.8% lower. As is the case today, chaotic and dysfunctional trading were hallmarks of the event. Stock prices fell an additional 32.1% before hitting their ultimate bottom on March 9, 2009. Despite this additional decline, the S&P 500 Index (price only) recovered 7.0% just 12 months after breaching the threshold at the dawn of the crisis.
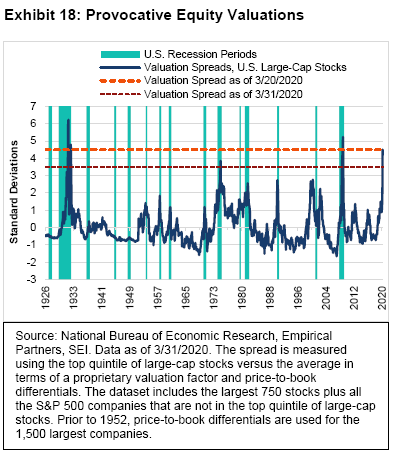
The extremely oversold condition of equities can be measured in other ways. Michael Goldstein, a quantitative strategist and founder of Empirical Partners, recently noted that U.S. stock market valuation spreads (the differential between the top quintile of stocks in terms of valuation versus the market average) are now at their widest level since the global financial crisis of 20084. The only time spreads were significantly wider was in 1932 during the worst part of the Great Depression. Exhibit 18 replicates Goldstein’s findings. Other international markets, both developed and emerging, are exhibiting similar valuation spread blowouts as the U.S.
Nobody knows how much weaker stock markets will get. It depends on the trajectory of the virus, the robustness of government responses, and the extent to which the economic shock causes corporate financial distress and layoffs. We do draw some comfort from the fact that markets began to recover from the global financial crisis within a year after reaching levels comparable to those of today. Exhibit 19 is a reminder that significant market drawdowns are fairly common in equity markets.
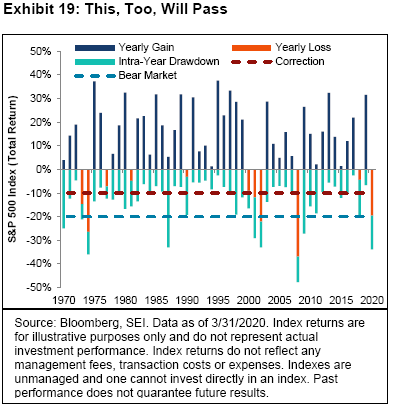
From 1970 to 2019, the average intra-year pullback (peak-to-trough) of the S&P 500 Index (total return) measured almost 14%. In 2020, the year-to-date drawdown has been harsh but not unprecedented. In three other periods with an intra-year drawdown of 20% or more (1970, 1987, 2009), the S&P 500 Index actually ended the year with gains. Accordingly, we do not believe it is unreasonable to assume that a sustained market recovery can take hold once the impact of the virus, both medically and economically, dissipates.
Global stock markets bounced back sharply in the week ending March 27 in reaction to the aggressive monetary and fiscal response of the U.S. and other developed countries. During that week, risk assets enjoyed a “face-ripping” rally, with large-cap equities climbing 20% in just three trading sessions, as measured by the S&P 500 Index (price only). Still, we’re not yet convinced that the bear market is behind us. There may be more big up-and-down days, perhaps even a retesting of the lows. It is too soon to say that the bottom in the S&P 500 Index has been established. Nonetheless, we are grateful that the chaotic trading seen in the previous week has eased considerably thanks to the liquidity provided by the Fed and the fiscal package passed by the U.S. Congress.
Exhibit 20 uses data from economist Ed Yardeni of Yardeni Research, Inc. to compare the actual level of the S&P 500 Index (price only) against would-be levels of the S&P 500 Index (price only) at different price-to-forward earnings ratios. Yardeni calls it the “Blue Angels” chart because the different price-to-forward-earnings (P/E) ratios lines “fly” in parallel formation like the famed U.S. Navy flight squadron of the same name, while the S&P 500 Index (depicted here as the blue line with square marks) cuts through the “contrails” of the various forward P/E ratio levels.
We like this chart because it not only shows how expensive the stock market is at any given moment relative to history, but it also provides the current trajectory of forward operating earnings (as projected by bottom-up analysts); climbing contrails point to rising earnings estimates, thereby supporting a higher stock price at a given P/E ratio.
One can see that the forward-earnings trend (the contrails) has flattened since the end of 2018. Analysts, however have been extremely slow to slash their earnings estimates in response to the shutdown of the U.S. economy; we have seen only a modest weakening to date. Part of the reason why earnings estimates haven’t moved sharply lower is the lack of clarity. Corporate management teams don’t know how deep the valley is, so there is no guidance. Analysts might also be figuring that the lockdown of the economy cannot continue for long. When it ends, earnings will likely rebound almost as sharply as they will fall over the next couple of quarters.
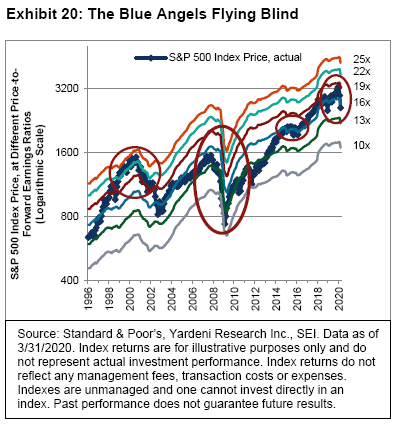
One thing is clear: Stocks have typically struggled when earnings decline or flatten out, as in the technology bust of 2000, the global financial crisis of 2008 and the growth scare of 2015 (all of which we highlight in Exhibit 20). Most of the recent price decline has been the result of a drop in the price-to-forward-earnings ratio. On March 23, the earnings multiple on the S&P 500 Index fell to less than 13.7 times the forward earnings of the next 12 months. After the market rebounded, the earnings multiple rose to near 16 times. We believe the higher number is based on earnings estimates that are almost certainly too high given current economic conditions, as shuttered business generate little in the way of earnings.
Only time will tell whether markets have sufficiently discounted the pain that lies immediately ahead. We have to be cognizant of the fact that earnings estimates are expected to come down hard—maybe by 40% to 50% on a year-over-year basis—over the next two quarters. These waterfall declines in earnings could drag equities down with them, but likely not to the same extent. It all depends on how willing investors are to look beyond the valley. If there is a belief that the fiscal and monetary measures taken in the past two weeks will successfully prop up the global economy, then markets should prove resilient. We think a great deal of volatility is still ahead of us, but another big decline along the lines of the past month could be avoided. Indeed, if there are signs that the infection rate is beginning to peak in Europe and the U.S., it may not matter where earnings go in the near term. Investors will likely begin to bid stock prices higher in anticipation of an economic recovery, as they almost always do.
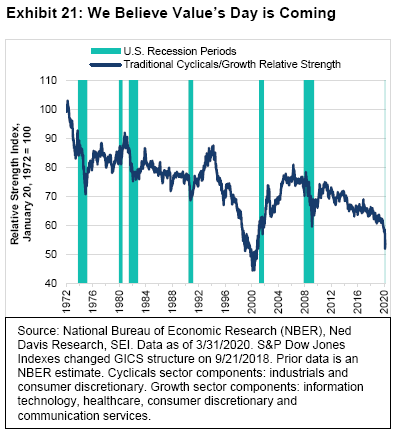
When that turn comes, we believe there could be a major change in stock-market leadership. For most of the previous expansion, companies that are sensitive to the economic cycle have lagged the equity performance of those exhibiting steadier growth and earnings characteristics. Exhibit 21 examines the relative stock-market performance of traditional cyclical sectors versus growth, as defined by Ned Davis Research. Note that a rotation into value usually occurs in the midst of a recessionary period. Cyclical stocks actually outperformed growth in 2009 and 2010, before falling into a prolonged relative decline. Since valuations are currently about as extreme as they get, SEI’s equity managers strongly believe that their bias toward value will prove beneficial.
Where do we go from here?
Given the speed at which events are occurring, much of what we have written is sure to be outdated in a matter of weeks, if not days. As the world continues to navigate its way out of the black swan’s path, we will continue our efforts to keep investors informed as best as we can. From a macro perspective, we will be monitoring the following:
- The trajectory of the virus. Clearly, the path of the virus will determine the length of the shutdown in economic activity as people shelter at home. In a very real sense, COVID-19 is like a giant tsunami rolling across the globe; the infection rate may fade in one part of the world (as it has in China and South Korea) only to begin wreaking havoc in other parts of the world. Europe and the U.S. are in the cross-hairs now. Other parts of the world, especially in the southern hemisphere, could feel the brunt of COVID-19 heading into their winter. India already ordered its population of 1.3 billion to shelter in place, in an effort to keep the disease at bay. In the U.S., even if COVID-19 loses its potency in New York and in other areas currently in lockdown, we expect new regional hot spots to crop up in the months to come.
- High frequency economic data. We have no doubt that most global economic data will look historically bad in the months ahead. But some numbers should provide a clue as to how deep the valley will be. Weekly data such as initial unemployment claims, chain-store sales and railroad traffic could prove helpful in gleaning insight. We will also look to monthly data that tend to lead inflection points in the economy. These include financial variables such as stock prices; the yield curve and changes in the money supply; survey data on consumer confidence and expectations; and measures of the real economy such as new orders, housing permits and passenger-car registrations.
- The pace of China’s recovery. As we said earlier, China was the first country to succumb to the virus—and the first country to begin to recover from it. We believe a strong bounce back in China’s economy would have a positive impact on the global economy, as China accounts for nearly 17% of world GDP and contributes to more than a one-third of global GDP growth. Signs of China’s recovery should show up in higher commodity prices, especially for copper. Copper and oil prices have tended to correlate with the direction of growth in China’s composite index of leading indicators: When growth is rising in the country, commodity prices usually pick up; when growth eases, copper and oil prices tend to weaken. Of course, the oil-price war being waged by the Saudi Arabia against Russia and frackers in the U.S. comes at a time global demand for oil is plunging. In the short-run, oil prices are likely to remain under considerable pressure. That may help energy consumers but is expected to add to the woes of producers already facing a simultaneous withdrawal of investor capital.
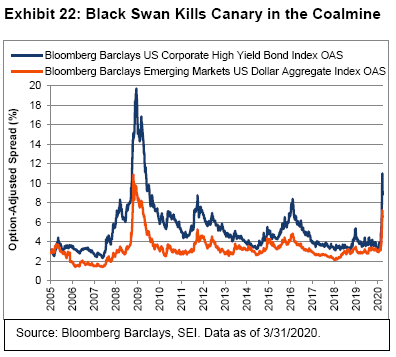
- The success (or failure) of central bank lending facilities. The early results have been promising. Although still volatile, fixed-income markets have responded positively in recent sessions, with yields coming down and bid/ask spreads narrowing in most, but not all, cases. Exhibit 22 highlights the daily moves in option-adjusted spreads (OAS) of U.S. high-yield and dollar-denominated emerging-market debt. At its peak on March 23, the spread on high-yield bonds (Bloomberg Barclays US Corporate High Yield Bond Index OAS) reached 11 percentage points, well over double from the end of last year. As of March 31, the option-adjusted spread fell back to 8.8 percentage points. In similar fashion, the spread on U.S. dollar-denominated emerging-market debt (Bloomberg Barclays Emerging Markets US Dollar Aggregate Index OAS), more than doubled from year-end 2019. It has since declined to 6.57 percentage points as of March 31.
Unprecedented events may open unprecedented opportunities
To sum it all up, COVID-19 is a black swan that radically changed our outlook. In a matter of weeks, the U.S. has gone from a full-employment economy to something that resembles the devastation wrought by the Great Depression. But this sudden devastation is not the result of disastrous economic policy decisions or unchecked speculation. This is a government-induced stoppage of economic activity meant to save lives. Around the world, national governments are deciding independently whether to do the same, but the universal response to mitigate the financial impact on people’s lives has been strong and coordinated to an unusual degree.
Investors are trying hard to value financial assets in a period of unprecedented uncertainty. Whether prices now reflect all the economic pain ahead is debatable. It depends on the trajectory of the virus, the effectiveness of newly implemented monetary and fiscal measures, and the confidence of investors.
With that, we offer some insight into how SEI’s portfolios have fared and how the investment managers we work with are navigating these difficult days:
SEI: A calm, logical, diversified approach
During periods of chaos in financial markets, investors often picture professional portfolio managers frantically trading in an effort to avoid the worst of the carnage while seeking opportunities to profit. At SEI, the reality couldn’t be further from the truth.
As we move deeper into the Year of the Black Swan, with a pandemic crippling the global economy and an oil glut exacerbated by suspended economic activity around the globe, we find ourselves in an environment almost completely void of reliable information—which, to us, makes frantic trading an especially unwise approach to financial stewardship. So, what are we doing?
In environments like this, investors, want to hear about the actions that we're taking. As Jim Smigiel, Chief Investment Officer of Non-traditional Strategies recently said, “…the answer isn’t terribly satisfying, but…from a strategic asset-allocation perspective, we're not really doing much. And that is by design. We don't build portfolios for raging bull markets. We build portfolios for market cycles. And market cycles will involve corrections, and that's what we're going through today. Diversification is what we focus on. We think about different ways of diversifying all our portfolios. We want to deliver as diversified as possible a portfolio to all of our investors, regardless of their risk tolerance. We have been in this asset allocation business for quite some time. That has always been our approach. We want to deal with the risks that we are aware of and that are inherent to the capital markets, but we also need to be able to deal with the unknowns—and the uncertainty that comes with any long-term investing plan. We build our portfolios to be robust. We are always looking for ways in which we can improve diversification, and this situation is no different. The relationships between asset classes will evolve over time, and we adjust our strategic allocations as appropriate. We think our models are robust and built to handle environments just like this.”
The approach Smigiel describes is no different than the one we took during the recent long and sometimes uncomfortable (for us) bull market. When the performance of a small group of large technology companies drove the direction of equity markets, we did not abandon our diversified approach for concentrated technology-heavy portfolios in an effort to chase performance. Rather, we stuck to our investment philosophy and process, maintaining our view that diversification is a sound approach over full market cycles—which include bull markets (which can last for over a decade) and bear markets (which vary in length and severity). We believe investors should take comfort in knowing this has not changed in today’s starkly different environment.
At SEI, when researching investment managers that we may hire, a key characteristic that we look for is consistent implementation of a well-defined investment philosophy and process. We seek growth managers that stick to their strategy, for example, even when value is leading the market. In short, a consistent, dependable process is what we want from our managers—and what we seek to deliver to our clients.
What are the investment managers doing?
We are in close touch with the managers as well as other vendors and suppliers, and can report that SEI remains operational. We want our clients to know that we have contingency plans in place at all of our global locations and have been in contact with our key business partners and investment managers to ensure business continuity.
On the equity side, our managers are assessing the situations in real time, and are adjusting exposures accordingly within their mandates. They have typically made small moves, done in a logical, controlled manner.
Potential adjustments include ways to both mitigate risk and seek to take advantage of the opportunities this dislocation is creating. We believe this dual approach is warranted given our view that any government-sponsored approach to fiscal stimulus will be large in scale and scope and will be priced in quickly. We can’t (due to a combination of regulatory constraints and practical considerations related to the speed of change in market conditions) provide a play-by-play review of every action taken by every manager. And we would be reluctant to do so even if we could (that stare-at-your-balance, day-trading mindset goes against every tenet of goals-based investing). However, we believe a general overview of our positioning at the asset class level provides insight into positioning and, hopefully, some comfort that the managers we work with are still implementing their mandates as we expect.
In general, our portfolios have not significantly changed their positioning compared to the end of 2019. In terms of performance, from an alpha source perspective, momentum continued to lead, supported by large technology and technology-related stocks. Groups such as financials and oil-related stocks were already showing poor momentum prior to the crisis. In this regard, our preference for value (which is largely strategic with a modest tactical, or short-term, overweight in most portfolios) has hurt performance; but in terms of valuation metrics, these stocks now look even more attractive. Stability has not performed as well as expected, due in large part to high correlations in markets. While low volatility has not done well, our managers have performed in line with low-volatility strategies in general during this disruptive period, so we don’t view our stability managers as having an issue.
That said, our managers are beginning to focus on quality companies with strong management teams and balance sheets that we view as having the best opportunity to survive the severe downturn in economic activity.
In our active U.S. large-cap strategies, we have encouraged our managers to look at utilities, an area that we have historically been underweight. At a high level our portfolios retain preferences for value and mid-cap stocks, which mostly represent long-term biases.
U.S. small-cap managers are doing some swapping of similar stocks to increase quality overall, while deeper value managers are looking at economically-sensitive areas such as consumer discretionary. Not much has changed overall.
Global equity portfolios have maintained their preference for value. Although this positioning has underperformed in recent years, it is now even more attractive, in our opinion. Many quality companies are trading at steep discounts. One change of note in our global equity portfolios is a reduction in exposure to stability via managed-volatility allocations. We note that liquidity is not a problem; however, trading costs are high so we are limiting transactions as much as possible.
Emerging-market equity portfolios have not made material changes in positioning and remain underweight China (financials, particularly banks). The expectation is that broad stimulus and central bank action will benefit consumer demand and spending.
Fixed-income markets have been challenging. Liquidity froze as investors frantically dumped holdings and fled to cash en masse. Bonds weren’t selling at reasonable prices, and there were almost no serious buyers. This is typical of trading in a panicked market and is a good way to lose money. Accordingly, SEI and the investment managers that we work with sought to address liquidity needs and avoid unnecessary trading in a temporarily chaotic market.
U.S. high-yield bonds are not trading well, as investors are selling their higher-quality holdings to maintain liquidity. We expect to have some “fallen angel” opportunities as formerly investment-grade rated BBB bonds get re-rated to below investment grade. Defaults will likely rise in this challenged environment, so we believe our continued defensive posture is warranted.
What now?
Investors have been looking for signs, seeking information, reading the news obsessively and—due to the enforced confinement taking place in many parts of the world—watching television at all of hours of the day and night.
But the pace of change—in market movements, virus spread and government response—has been so rapid that information is generally out of date nearly as soon as it is reported. So, what does this mean?
For one thing, we think checking your portfolio’s balance every day is about as helpful as watching the news these days. It won’t do anything to ease your nerves. At a portfolio level, we encourage investors to stay diversified and avoid short-term trading in these volatile markets.
If you are a goals-based investor—and your portfolio is aligned with your goals, time horizon and risk tolerance—be patient. Time should be on your side.
If your portfolio was not aligned with your goals as the selloff began, we think it’s too late to sell now. Doing so may mean you’ll risk missing the rebound that will inevitably happen. No one—including those of us in the financial-services industry—knows exactly when that will take place. But we are confident that the markets will eventually have their comebacks. It may take months—but order will be restored.
Until then, what should you do? Read, watch, listen and learn. You’re seeing black swans. Use this experience to become a better, more informed investor. We will continue to monitor economic and financial-market developments and provide our insight to help you achieve that goal.
Glossary
Alpha source is a term used by SEI as part of our internal classification system to categorize and evaluate investment managers in order to build diversified fund portfolios. An alpha source is the investment approach taken by an active investment manager in an effort to generate excess returns. Another way to define an alpha source is that it is the inefficiency that an active investment manager seeks to exploit in order to add value.
Cyclical sectors, industries or stocks are those whose performance is closely tied to the economic environment and business cycle. Cyclical sectors tend to benefit when the economy is expanding.
Earnings multiple is equal to the stock price divided by earnings per share. It is expressed in years. For example, an earnings multiple of 10 means that it would take 10 years of earnings to equal the stock price.
Hard currency refers to the currencies of industrialized nations that are seen as politically and economically stable. Hard currencies typically do not depreciate suddenly or fluctuate greatly in value.
Option-Adjusted Spreads estimate the difference in yield between a security or collection of securities and comparable Treasurys after removing the effects of any special features, such as provisions that allow an issuer to call a security before maturity.
P/E ratio is equal to a company’s market capitalization divided by its after-tax earnings. The higher the P/E ratio, the more the market is willing to pay for each dollar of annual earnings. A forward P/E ratio is a current stock’s price divided by its estimated earnings per share over the next 12 months.
Value refers to the tendency of relatively cheap assets to outperform relatively expensive assets.
Index Definitions
Bloomberg Barclays Emerging Markets US Dollar Aggregate Index: a hard-currency emerging-market index representing USD-denominated debt from sovereign, quasi-sovereign and corporate debt issuers.
Bloomberg Barclays Global Aggregate Bond Index: an unmanaged market-capitalization-weighted benchmark, tracks the performance of investment-grade fixed-income securities.
Bloomberg Barclays Municipal 3-15 Years Blend Index: consists of tax-exempt general obligation, revenue and private-activity bonds and notes, which are issued by or on behalf of states, territories or possessions of the U.S. and the District of Columbia and their political subdivisions, agencies and instrumentalities, with a remaining maturity of more than 2 years and less than 17 years.
Bloomberg Barclays US Aggregate Bond Index: a benchmark index composed of U.S. securities in Treasury, government-related, corporate and securitized sectors. It includes securities that are of investment-grade quality or better and have at least one year to maturity.
Bloomberg Barclays US Corporate High Yield Bond Index: measures the USD-denominated, high-yield, fixed-rate corporate bond market. Bonds from issuers with an emerging-markets country of risk are excluded.
Bloomberg Barclays US Treasury Bellwethers 10-Year Index: an unmanaged index that is composed of the most recently auctioned 10-year Treasury bond and is used as a benchmark for long-term maturity fixed-income securities.
Bloomberg Barclays US Treasury Bellwethers 30-Year Index: an unmanaged index that is composed of the most recently auctioned 30-year Treasury bond and is used as a benchmark for long-term maturity fixed-income securities.
Composite Index of Leading Indicators: used to measure turning points in the business cycle. The metric looks at qualitative data on short-term economic movements. It is used to predict the direction of global economic movements in future months.
ICE BofA US High Yield Constrained Index: a market-value weighted index of all domestic and Yankee high-yield bonds, including deferred interest bonds and payment-in-kind securities. Its securities have maturities of one year or more and a credit rating lower than BBB-/Baa3 but are not in default.
JP Morgan GBI-EM Global Diversified Composite Index: tracks the performance of debt instruments issued in local currencies by emerging-market governments.
MSCI USA Index: designed to measure the performance of the large- and mid-cap segments of the U.S. market. The Index covers approximately 85% of the free float-adjusted market capitalization in the U.S.
MSCI World ex USA Index: a free float-adjusted market capitalization weighted index that is designed to measure the equity market performance of developed markets, not including the U.S.
MSCI Emerging Markets Index: a free float-adjusted market-capitalization-weighted index designed to measure the performance of global emerging-market equities.
Purchasing Managers’ Index: an indicator of economic health for manufacturing and service sectors. Its purpose is to provide information about current business conditions to company decision makers, analysts and purchasing managers.
S&P 500 Index: an unmanaged, market-weighted index that consists of 500 of the largest publicly-traded U.S. companies and is considered representative of the broad U.S. stock market.
S&P/TSX Composite Index: the headline index for the Canadian equity market. It is the broadest in the S&P/TSX family and is the basis for multiple sub-indexes including but not limited to equity indexes, Income Trust indexes, Capped indexes, GICS indexes and market-cap based indexes. The Toronto Stock Exchange (TSX) serves as the distributor of both real-time and historical data for this index.
S&P/TSX SmallCap Index: provides an investable index for the Canadian small-cap market. The Index is float-adjusted and market-cap weighted and was developed with industry input as the ideal benchmark for those with small-cap exposure of the Canadian equity market.
Important Information
SEI Investments Canada Company, a wholly owned subsidiary of SEI Investments Company, is the Manager of the SEI Funds in Canada.
The information contained herein is for general and educational information purposes only and is not intended to constitute legal, tax, accounting, securities, research or investment advice regarding the Funds or any security in particular, nor an opinion regarding the appropriateness of any investment. This commentary has been provided by SEI Investments Management Corporation (“SIMC”), a U.S. affiliate of SEI Investments Canada Company. SIMC is not registered in any capacity with any Canadian regulator, nor is the author, and the information contained herein is for general information purposes only and is not intended to constitute legal, tax, accounting, securities, or investment advice, nor an opinion regarding the appropriateness of any investment. You should not act or rely on the information contained herein without obtaining specific legal, tax, accounting and investment advice from qualified professionals. This information should not be construed as a recommendation to purchase or sell a security, derivative or futures contract. You should not act or rely on the information contained herein without obtaining specific legal, tax, accounting and investment advice from an investment professional. This material represents an assessment of the market environment at a specific point in time and is not intended to be a forecast of future events, or a guarantee of future results. There is no assurance as of the date of this material that the securities mentioned remain in or out of the SEI Funds.
This material may contain "forward-looking information" ("FLI") as such term is defined under applicable Canadian securities laws. FLI is disclosure regarding possible events, conditions or results of operations that is based on assumptions about future economic conditions and courses of action. FLI is subject to a variety of risks, uncertainties and other factors that could cause actual results to differ materially from expectations as expressed or implied in this material. FLI reflects current expectations with respect to current events and is not a guarantee of future performance. Any FLI that may be included or incorporated by reference in this material is presented solely for the purpose of conveying current anticipated expectations and may not be appropriate for any other purposes.
There are risks involved with investing, including loss of principal. Diversification may not protect against market risk. There may be other holdings which are not discussed that may have additional specific risks. In addition to the normal risks associated with investing, international investments may involve risk of capital loss from unfavourable fluctuation in currency values, from differences in generally accepted accounting principles or from economic or political instability in other nations. Emerging markets involve heightened risks related to the same factors, in addition to those associated with their relatively small size and lesser liquidity. Bonds and bond funds will decrease in value as interest rates rise.
Information contained herein that is based on external sources is believed to be reliable, but is not guaranteed by SEI Investments Canada Company, and the information may be incomplete or may change without notice.
Commissions, trailing commissions, management fees and expenses all may be associated with mutual fund investments. Please read the prospectus before investing. Mutual funds are not guaranteed, their values change frequently and past performance may not be repeated.


