Looking Beyond the Fear: An Analysis of Sharp Selloffs
What do stock-market prices tell us? Lately, they’ve been telling us that investors are afraid. They also suggest that stocks are beginning to look like a bargain.
Putting a Price on Stocks: What’s it Worth Today?
Academics characterize stock markets as forward-looking discounting mechanisms. More simply stated, this means that, as a collective group, investors use all available information about the future in an effort to put a value on a company.
This exercise—in which forward-looking expectations produce a current price—is known as discounted earnings analysis. It’s based on the idea that we can determine the current value of a future payment or income stream by “discounting” it backward through time at a pre-determined rate. Scaled up from individual companies to the market level, pricing should reflect all available information about the future earnings potential of the market, serving as a partial proxy for the economy.
Rapid Repricing Resembles Panic
Armed with this understanding of how new information gets factored into prices, we can sympathize with the challenge presented by a quickly evolving (or deteriorating) environment. The onslaught of developments presented by COVID-19’s spread and a simultaneous collapse in oil prices has forced financial markets to recalibrate prices sharply as expectations about different industries and the overall economy shift at a breakneck pace.
What’s it Worth in the Future?
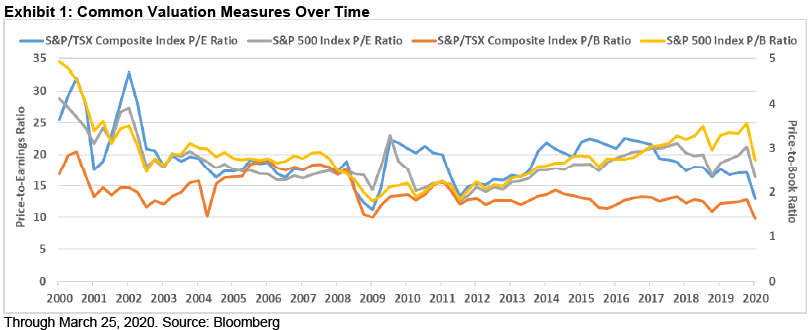
One way to think about the market’s forward-looking focus is with well-known metrics like the price-to-earnings (P/E) or price-to-book (P/B) ratios. The S&P/TSX Composite Index and S&P 500 Index had trailing P/E ratios of approximately 15 on March 25, 2020, meaning that investors must pay a price equal to 15 times the estimated annual earnings of its constituent companies to buy them. That’s the next 60 quarters of earnings.
There’s some reassurance in the fact that a COVID-19-containment-induced earnings recession is generally only expected to last a couple quarters or so. If market prices are based on the next 60 quarters, then this fallout—while new and uncomfortable—represents a tiny part of the market’s forward-looking focus.
Not Quite a Silver Lining
A couple quarters of poor earnings are not going to create permanent damage for a well-designed long-term investment strategy. But we understand that it’s also not going to make investors feel better about the value of their accounts today.
The aforementioned ratios are fundamental measures used to help determine the underlying value of a stock, index or market. They tell us whether an investment is cheap or expensive according to a given measure. They don’t, however, make any claim about the future direction of prices over any specific time frame.
Technical measures, on the other hand, track the price of a stock, index or market as a standalone measure. Technicals use historical prices and patterns to help develop forward-looking expectations about price direction.
Sharp selloffs can produce what market technicians describe as “oversold” levels. We can use the 200-day simple moving average (that is, a stock’s average price over the last 200 days) as a measure of whether the math suggests that it’s oversold, or has fallen too far, too fast.
If we look at the price of each constituent stock in the S&P 500 Index relative to its own 200-day moving average, we can estimate the extent to which U.S. stocks are oversold.
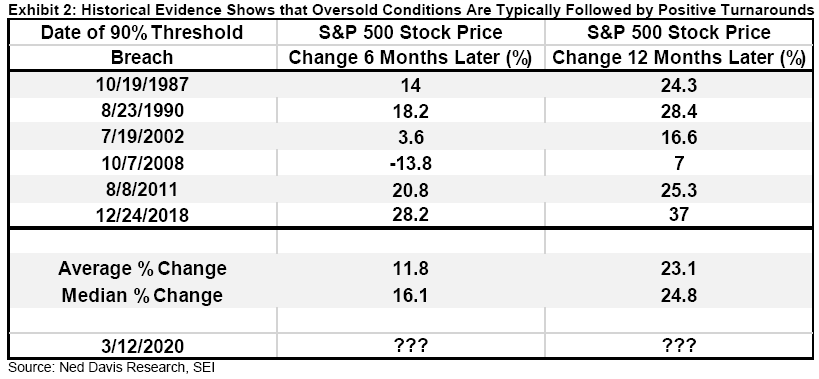
Exhibit 2 shows the historical track record 6 and 12 months after the date when 90% of S&P 500 Index constituents first pierced their respective 200-day moving averages on the way down. This study goes back to the Crash of 1987 and the latest 90% trigger took place on March 12, 2020.
We can see that the S&P 500 Index was positive six months later in every case except the Global Financial Crisis from 2008 to 2009. Looking out 12 months from the 90% threshold, however, shows positive performance in every case.
SEI’s View
While past performance is no guarantee of future results, we think the math contains an important message for investors. All of the available information right now has compelled investors to push stock prices to their cheapest valuations in years (the P/E ratio for the S&P/TSX Composite Index is at its lowest level since early 2009 and the P/B ratio has not been this low for at least 20 years).
Furthermore, as the oversold indicator suggests, these types of technical conditions have historically preceded positive turnarounds.
While math and logic don’t always look correct over short time frames, sharp selloffs provide investors with an opportunity to own stocks at inexpensive levels under historical conditions that should inspire confidence. Looking beyond the fear with a critical eye will enable investors to see the opportunity that’s beginning to take shape.
Important Information
SEI Investments Canada Company, a wholly owned subsidiary of SEI Investments Company, is the Manager of the SEI Funds in Canada.
The information contained herein is for general and educational information purposes only and is not intended to constitute legal, tax, accounting, securities, research or investment advice regarding the Funds or any security in particular, nor an opinion regarding the appropriateness of any investment. This information should not be construed as a recommendation to purchase or sell a security, derivative or futures contract. You should not act or rely on the information contained herein without obtaining specific legal, tax, accounting and investment advice from an investment professional. This material represents an assessment of the market environment at a specific point in time and is not intended to be a forecast of future events, or a guarantee of future results. There is no assurance as of the date of this material that the securities mentioned remain in or out of the SEI Funds.
This material may contain "forward-looking information" ("FLI") as such term is defined under applicable Canadian securities laws. FLI is disclosure regarding possible events, conditions or results of operations that is based on assumptions about future economic conditions and courses of action. FLI is subject to a variety of risks, uncertainties and other factors that could cause actual results to differ materially from expectations as expressed or implied in this material. FLI reflects current expectations with respect to current events and is not a guarantee of future performance. Any FLI that may be included or incorporated by reference in this material is presented solely for the purpose of conveying current anticipated expectations and may not be appropriate for any other purposes.
Information contained herein that is based on external sources or other sources is believed to be reliable, but is not guaranteed by SEI Investments Canada Company, and the information may be incomplete or may change without notice.
There are risks involved with investing, including loss of principal. Diversification may not protect against market risk. There may be other holdings which are not discussed that may have additional specific risks. In addition to the normal risks associated with investing, international investments may involve risk of capital loss from unfavourable fluctuation in currency values, from differences in generally accepted accounting principles or from economic or political instability in other nations. Emerging markets involve heightened risks related to the same factors, in addition to those associated with their relatively small size and lesser liquidity. Bonds and bond funds will decrease in value as interest rates rise.
Index returns are for illustrative purposes only, and do not represent actual performance of an SEI Fund. Index returns do not reflect any management fees, transaction costs or expenses. Indexes are unmanaged and one cannot invest directly in an index.
Commissions, trailing commissions, management fees and expenses all may be associated with mutual fund investments. Please read the prospectus before investing. Mutual funds are not guaranteed, their values change frequently and past performance may not be repeated.


