U.S. large-caps: Is it skill or just beta (risk)?
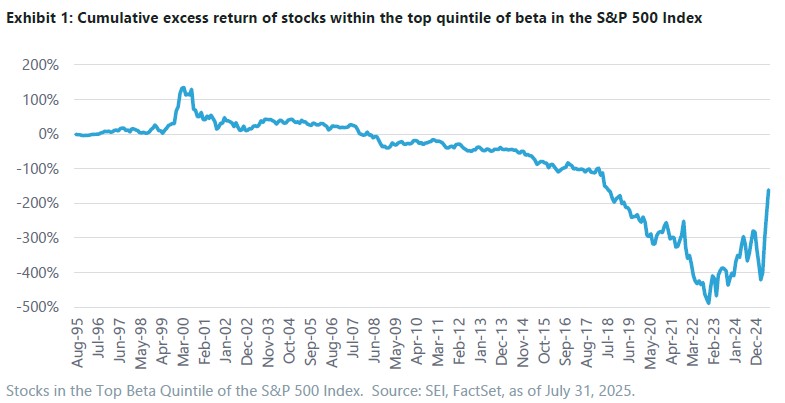
U.S. equity markets are sitting at all-time highs driven by some of the riskiest stocks in the market. Theory says high-risk stocks should have higher returns than less risky stocks. In reality, the riskiest stocks have tended to underperform over the long term.
Beta as a risk metric
Beta is a metric that measures an investment’s risk relative to the overall market. A beta of 1 indicates risk commensurate with equity markets, while above or below 1 indicate more or less risk, respectively. Simply put, higher beta normally equals more risk.
Conventional investment theory says that portfolios must provide more return as the level of risk increases because investors should require compensation for taking on more risk. In reality, this relationship has not been linear. Further, as investors add more risk the amount of compensation they receive is less than the additional risk taken. Notably, when ranked by beta, the top quintile (top 20%) of stocks in the S&P has underperformed over the long-term relative to the overall index.
Excess return is a measure of the performance that an active manager produces above or below a benchmark or index. Ideally an active manager would be able to beat the index without taking more risk than an index fund. This would be potential evidence of skill by the active manager.
Guided by history (including the drawdowns)
Recently, the U.S. large cap market has been driven to new record highs by a small number of mega-cap stocks. These mega-cap stocks have pushed U.S. valuations higher relative to both history and versus foreign stocks.
Historically, we’ve seen certain time periods in which some investment managers took high-beta positions and generated spectacular gains only to post significant losses when market leadership shifted. There have been past instances where higher-beta investments have provided substantial positive excess returns—namely the “Tech Bubble” of the late 1990s and of course the past two-and-a-half years with “Magnificent 7” leadership. Still, even accounting for these periods, high-beta stocks have simply not kept up with the S&P 500 Index when long-term compounding includes the drawdowns.
MAR ratio
Now, we examine the past 10 years of returns for the highest-beta U.S. large-cap money managers to see how they fared when using a risk adjustment that compares the managers’ returns to their portfolio’s biggest drawdown. Given that bear markets (declines of over 20%) do occur and should be expected to occur again in the future, it is important to understand how a money manager’s investment strategy may fare in such an environment. By using a metric such as the MAR ratio1, it is possible to compare the performance pattern of a high-beta manager to the S&P 500 Index to determine whether the upside experience is sufficiently better to warrant the downside experience associated with the strategy. Intuitively, a higher MAR ratio is better.
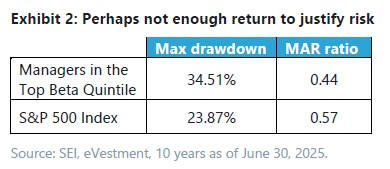
The good news for the highest-beta quintile of active U.S. large-cap managers is that they managed to outperform the S&P 500 Index over the past 10 years. The bad news is that their MAR ratios are worse than those of the index and this might not bode well for future environments when markets provide returns that are more typical of long-term averages when compounding includes drawdowns.
Buyer beware: Beta is just risk
History suggests that we are in an environment where excess risk is being rewarded in equity markets. While beta is a factor that can sometimes outperform, historical results have not shown this to be a persistent source of performance. Whether you’re looking at an exchange-traded fund, mutual fund, or another investment strategy at this time, it would be wise to consider the level of beta/risk in that investment—even popular passive index investment have become notably concentrated and thus riskier due to market capitalization weighting. We believe investors should focus on portfolios that can benefit from security selection and factors—value, quality, momentum, and low volatility that have historically produced long-term excess returns while being less dependent on “risk on” market sentiment.
Important information
This material represents an assessment of the market environment at a specific point in time and is not intended to be a forecast of future events or a guarantee of future results. Positioning and holdings are subject to change. All information as of the date indicated. There are risks involved with investing, including possible loss of principal. This information should not be relied upon by the reader as research or investment advice, unless you have otherwise separately entered into a written agreement with SEI for the provision of investment advice) nor should it be construed as a recommendation to purchase or sell a security. The reader should consult with their financial professional for more information.
Statements that are not factual in nature, including opinions, projections and estimates, assume certain economic conditions and industry developments and constitute only current opinions that are subject to change without notice. Nothing herein is intended to be a forecast of future events, or a guarantee of future results.
Certain economic and market information contained herein has been obtained from published sources prepared by other parties, which in certain cases have not been updated through the date hereof. While such sources are believed to be reliable, neither SEI nor its affiliates assumes any responsibility for the accuracy or completeness of such information and such information has not been independently verified by SEI.
There are risks involved with investing, including loss of principal. The value of an investment and any income from it can go down as well as up. Investors may get back less than the original amount invested. Returns may increase or decrease as a result of currency fluctuations. Past performance is not a reliable indicator of future results. Investment may not be suitable for everyone.
Index returns are for illustrative purposes only and do not represent actual investment performance. Index performance returns do not reflect any management fees, transaction costs or expenses. Indexes are unmanaged, and one cannot invest directly in an index. Past performance does not guarantee future results.
This material is not directed to any persons where (by reason of that person's nationality, residence or otherwise) the publication or availability of this material is prohibited. Persons in respect of whom such prohibitions apply must not rely on this information in any respect whatsoever.
The information contained herein is for general and educational information purposes only and is not intended to constitute legal, tax, accounting, securities, research or investment advice regarding the strategies or any security in particular, nor an opinion regarding the appropriateness of any investment. This information should not be construed as a recommendation to purchase or sell a security, derivative or futures contract. You should not act or rely on the information contained herein without obtaining specific legal, tax, accounting and investment advice from an investment professional.
The views contained herein are not to be taken as advice or a recommendation to buy or sell any investment in any jurisdiction. Our outlook contains forward-looking statements that are judgments based upon our current assumptions, beliefs, and expectations. If any of the factors underlying our current assumptions, beliefs or expectations change, our statements as to potential future events or outcomes may be incorrect. We undertake no obligation to update our forward-looking statements.
Information in the U.S. is provided by SEI Investments Management Corporation (SIMC), a wholly owned subsidiary of SEI Investments Company (SEI).
Information in Canada is provided by SEI Investments Canada Company, a wholly owned subsidiary of SEI Investments Company (SEI), and the Manager of the SEI Funds in Canada.
In the UK and the EEA this information issued in the UK by SEI Investments (Europe) Ltd, 1st Floor, Alphabeta, 14-18 Finsbury Square, London EC2A 1BR which is authorised and regulated by the Financial Conduct Authority. Investments in SEI Funds are generally medium- to long-term investments.
The contents of this document have not been reviewed by any regulatory authority in Hong Kong. You are advised to exercise caution in relation to the offer. If you are in any doubt about any of the contents of this document, you should obtain independent professional advice.
This document has not been registered as a prospectus with the Monetary Authority of Singapore.
This information is made available in Latin America, the Middle East and Australia FOR PROFESSIONAL (non-retail) USE ONLY by SIEL.
Any questions you may have in relation to its contents should solely be directed to your Distributor. If you do not know who your Distributor is, then you cannot rely on any part of this document in any respect whatsoever.
SIEL is not licensed under Israel’s Regulation of Investment Advising, Investment Marketing and Portfolio Management Law, 5755-1995 (the “Advice Law”) and does not carry insurance pursuant to the Advice Law. No action has been or will be taken in Israel that would permit a public offering or distribution of the SEI Funds mentioned in this email to the public in Israel. This email and any of the SEI Funds mentioned herein have not been approved by the Israeli Securities Authority (the “ISA”).
Issued in South Africa by SEI Investments (South Africa) (Pty) Limited FSP No. 13186 which is a financial services provider authorised and regulated by the Financial Sector Conduct Authority (FSCA). Registered office: 3 Melrose Boulevard, 1st Floor, Melrose Arch 2196, Johannesburg, South Africa.


