Will This Bull Run Forever?
The latest bull-market cycle began during the worst phase of the economic cycle, as is often the case. Many countries were locking down their economies as deaths from COVID-19 were rising in uncontrolled fashion in the northeastern U.S. and throughout Europe. When it became clear that massive monetary and fiscal support was on its way, markets responded immediately in anticipation of a successful rescue effort.
What has perhaps been more surprising is the relentlessness of the global stock-market rally over the past 18 months, with the S&P 500 setting the pace. As illustrated in Exhibit 1, despite ongoing challenges—such as the repeated waves of new COVID-19 infections around the world; the persistent shortages of goods and labour; ever-surging inflation rates; and the imminent fading of government economic relief—the bull market has continued its advance. In fact, the S&P 500 Index managed to avoid even a minor dip of 5% until the last trading session of September, when it posted a 5.06% drop from its all-time closing high achieved September 2, 2021. It had been almost a full year since this measure of the stock market last recorded a drop of 5% or more.
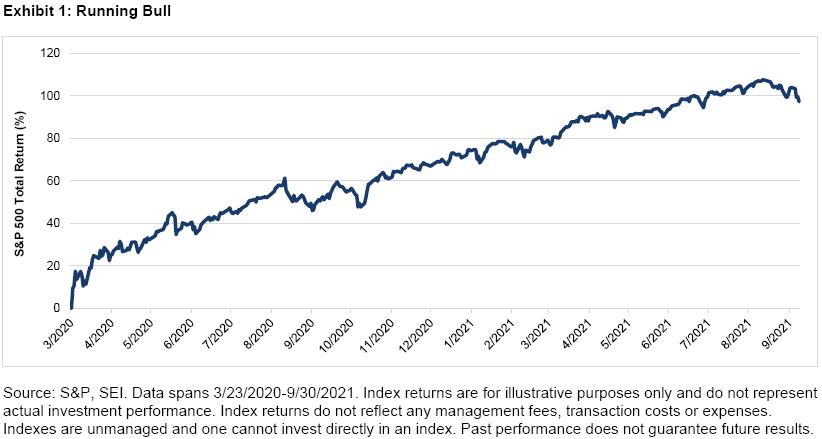
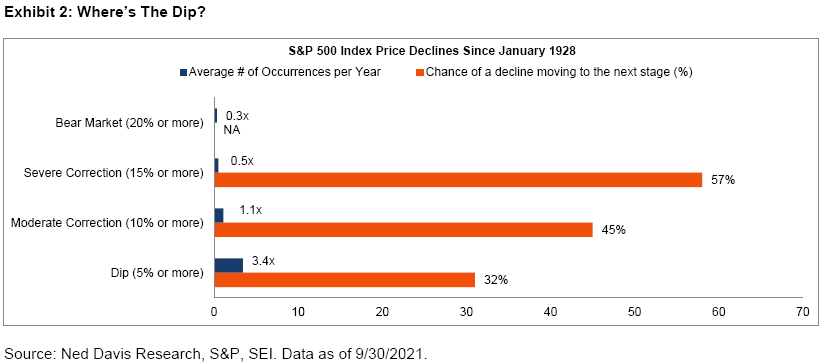
Exhibit 2 highlights the history of price declines in the S&P 500 Index (price-only) since 1928. Over this time span, a price dip of 5% or more has occurred three-to-four times in an average year. And less than one-third of those dips turned into a more serious downturn. Remarkably, since the brief bear market associated with the onset of the pandemic in the early months of 2020, the S&P 500 Index hasn’t experienced even a moderate correction of 10% or more (which typically take place about once a year)
Severe corrections (15% or more) usually occur once every two years. The last time the S&P 500 dropped that much was during the February-to-March 2020 slide. Prior to that, there were only two severe corrections in the previous 10 years: between October and December 2018 and in the August-to-September 2011 period. As Exhibit 2 shows, 45% of moderate corrections have turned into severe ones, and 57% of severe corrections have morphed into bear markets of 20% or more. Bear markets have occurred, on average, once every 40 months since 1928. However, there have been only six downturns since 1979 that qualified as bear markets under this definition—amounting to one bear market every seven years. Perhaps we should start calling bear markets the “Seven-Year Glitch.”
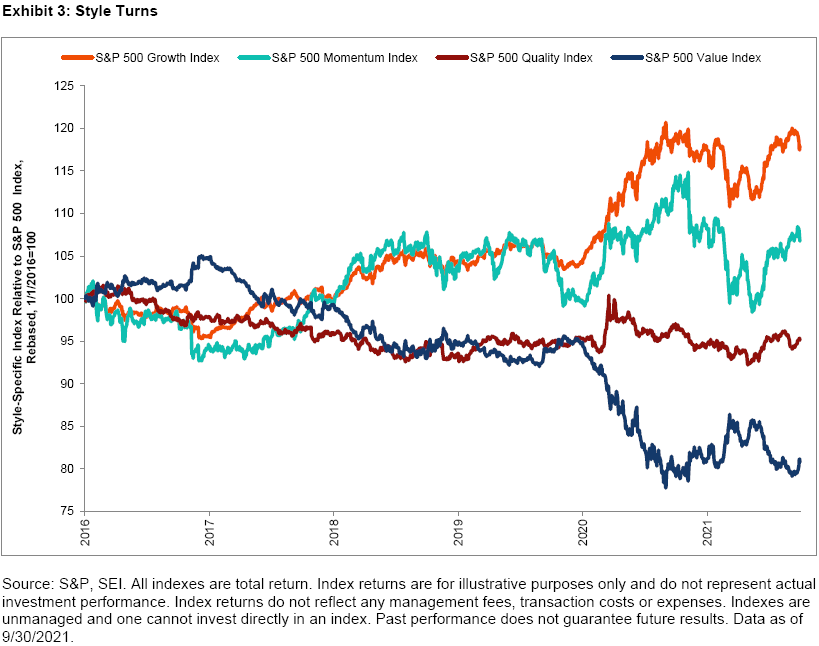
Underneath the currently placid surface of the market, one can nevertheless find signs of investor nervousness. Exhibit 3 on the following page examines the total-return performance of the S&P 500 Index by style relative to the overall S&P 500 Index (total return) over the past five years. (These style-specific indexes are published by S&P Dow Jones, a division of S&P Global1.)
The growth and momentum investment styles have made a big comeback relative to the overall S&P 500 Index since the middle of May 2021—approximately when the Delta variant of COVID-19 was wreaking havoc in India and just one week before the U.K. entered a two-month surge in caseloads. Other countries including the U.S. soon followed the same dismal trajectory in infection rates. In a natural reaction to the prospect of more lockdowns and delayed returns to normal life, investors revisited those companies that benefited the most during 2020—namely the work-at-home, big technology stocks and other high-multiple companies that do well when interest rates fall.
\
It’s no coincidence that rally in both growth and momentum stocks coincided with these events. Although the S&P 500 Growth Index and S&P 500 Momentum Index represent distinct investing styles, over 40% of their total market capitalizations are both dominated by information technology stocks—which represent a huge portion of those companies that investors flocked to as the Delta variant surged.
Meanwhile, the S&P 500 Value Index, which holds far fewer information technology stocks, has given up nearly all the relative ground it gained between September 2020 and March 2021.
What’s next?
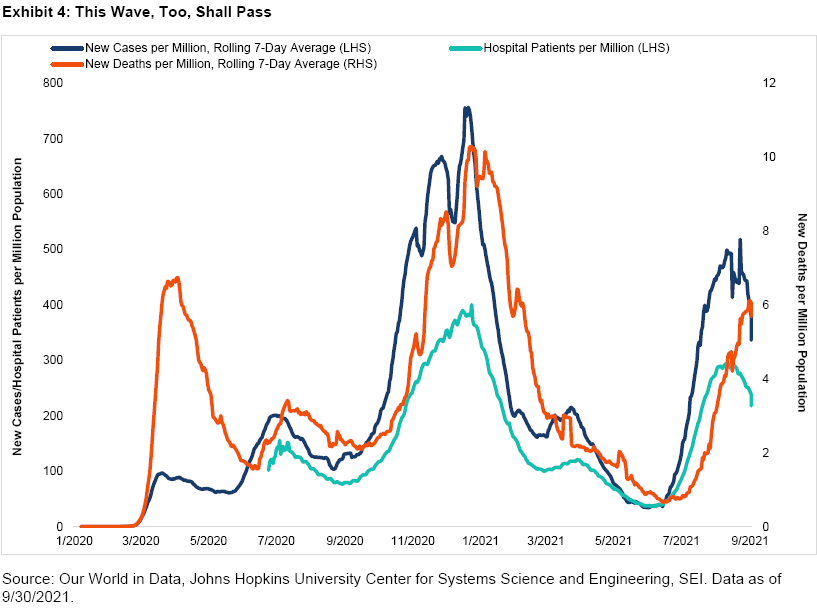
The shift in investor interest back toward the growth-oriented large-cap stocks in the U.S. is understandable. Exhibit 4 on the next page shows how sharply the seven-day average of daily new cases, hospitalizations and deaths per million population have climbed in the U.S. over recent months. The number of cases in the U.S. appears to be cresting, but there is no guarantee that it will continue. We are, after all, heading into that time of year when respiratory illnesses take hold because school is back in session and people are moving indoors and gathering together for the holidays. On a positive note, vaccinations are picking up again, the most vulnerable parts of the population are now receiving booster shots, and younger children should gain access to the vaccine before the end of the year.
We therefore do not expect the recent bounce-back in the growth and momentum styles at the expense of value and cyclical stocks to be a long-lasting one. In our view, economic growth in the U.S. and globally should continue over the next year or two at a rate that meaningfully exceeds the sluggish pace of the years that followed the 2007-to-2009 global financial crisis.
This does not mean that we expect the bull market to advance in an uninterrupted fashion forever. We have been humbled enough times in the past not to put a date on a pullback or predict the level of a future decline. But we do believe that temporary pullbacks are a normal and expected part of the market cycle, and we would not be surprised to see the current one extend a bit further. Keep in mind that severe corrections and bear markets are typically associated with significant economic disruption, which we do not anticipate occurring anytime soon. In any event, we do not believe that short-term market fluctuations—even corrections of more than 10%—are a valid reason to abandon a well-constructed asset allocation that serves as the foundation of a long-term investment portfolio. If anything, we think such dips should serve as reminders that maintaining a disciplined approach in all market environments should help investors stay on the path to achieving their long-term investment objectives.
Glossary
Growth stocks exhibit steady earnings growth above that of the broader market.
High-multiple companies have stock prices that are high relative to their level of earnings.
Momentum refers to a trend-following investment strategy that is based on acquiring assets with recent improvement in their price, earnings, or other relevant fundamentals.
Value refers to a mean-reverting investment strategy based on acquiring assets at a discount to their fair valuation.
Index Definitions
The S&P 500 Index is an unmanaged, market-weighted index that consists of approximately 500 of the largest publicly traded U.S. companies and is considered representative of the broad U.S. stock market.
The S&P 500 Growth Index measures the performance of growth stocks in the S&P 500 Index. The S&P 500 Momentum Index measures the performance of securities in the S&P 500 Index that exhibit persistence in their relative performance.
The S&P 500 Quality Index measures the performance of high quality stocks in the S&P 500 Index by quality score, which is calculated based on return on equity, accruals ratio and financial leverage ratio.
The S&P 500 Value Index measures the performance of value stocks in the S&P 500 Index.
Important Information
Investment strategy positioning information is current as of September 20, 2021.
SEI Investments Canada Company, a wholly owned subsidiary of SEI Investments Company, is the investment fund manager and portfolio manager of the SEI Funds in Canada.
The information contained herein is for general and educational information purposes only and is not intended to constitute legal, tax, accounting, securities, research or investment advice regarding the Funds or any security in particular, nor an opinion regarding the appropriateness of any investment. This information should not be construed as a recommendation to purchase or sell a security, derivative or futures contract. You should not act or rely on the information contained herein without obtaining specific legal, tax, accounting and investment advice from an investment professional. This material represents an assessment of the market environment at a specific point in time and is not intended to be a forecast of future events, or a guarantee of future results. There is no assurance as of the date of this material that the securities mentioned remain in or out of the SEI Funds.
This material may contain "forward-looking information" ("FLI") as such term is defined under applicable Canadian securities laws. FLI is disclosure regarding possible events, conditions or results of operations that is based on assumptions about future economic conditions and courses of action. FLI is subject to a variety of risks, uncertainties and other factors that could cause actual results to differ materially from expectations as expressed or implied in this material. FLI reflects current expectations with respect to current events and is not a guarantee of future performance. Any FLI that may be included or incorporated by reference in this material is presented solely for the purpose of conveying current anticipated expectations and may not be appropriate for any other purposes.
Information contained herein that is based on external sources or other sources is believed to be reliable, but is not guaranteed by SEI Investments Canada Company, and the information may be incomplete or may change without notice. Sources include Bloomberg, FactSet, MorningStar and BlackRock.
There are risks involved with investing, including loss of principal. Diversification may not protect against market risk. There may be other holdings which are not discussed that may have additional specific risks. In addition to the normal risks associated with investing, international investments may involve risk of capital loss from unfavourable fluctuation in currency values, from differences in generally accepted accounting principles or from economic or political instability in other nations. Emerging markets involve heightened risks related to the same factors, in addition to those associated with their relatively small size and lesser liquidity. Bonds and bond funds will decrease in value as interest rates rise.
Index returns are for illustrative purposes only, and do not represent actual performance of an SEI Fund. Index returns do not reflect any management fees, transaction costs or expenses. Indexes are unmanaged and one cannot invest directly in an index.
Commissions, trailing commissions, management fees and expenses all may be associated with mutual fund investments. Please read the prospectus before investing. Mutual funds are not guaranteed, their values change frequently and past performance may not be repeated.


