After Forced Selling, is it Time for a Small-Cap Comeback?
At the start of what would become the previous two U.S. bear markets in 2000 and 2007, the S&P 500 Index had dropped about 5% one month after reaching its peak levels at the time.
However, just 30 days after hitting an all-time high on February 19, 2020, the S&P 500 Index had fallen by more than 30%, as seen in Exhibit 1.
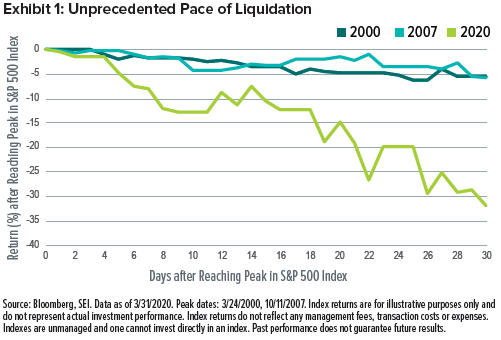
The rapid pace of selling in March 2020 was historical. Why? The coronavirus outbreak was a completely unexpected and outsized external shock. Plus, its eventual economic impact remains uncertain.
Defensive sectors, such as utilities and consumer staples, typically provide some measure of risk mitigation in a falling market at the cost of not rising as much in an upward move. Cyclical securities, such as those in the industrials and information technology sectors, usually rise in tandem with the market—but also generally drop faster when the market falls.
We can see this in the betas of stocks by sector. Broadly speaking, beta measures how much a stock moves relative to the overall market. Think of it as the comparative riskiness of a stock for an investor.
A broad equity index has a beta of 1. A stock that moves less than the market appears less risky and therefore has a beta of less than 1. On the other hand, stocks that move more than the market are seen as riskier and have a beta of higher than 1.
The speed and magnitude of the coronavirus outbreak hit equity markets in an unprecedented way. Between the Russell 3000 Index peak on February 19, 2020 and March 31, 2020, there was surprisingly little difference in returns between those sectors perceived as lower-risk and those perceived as higher-risk before the crisis (Exhibit 2).
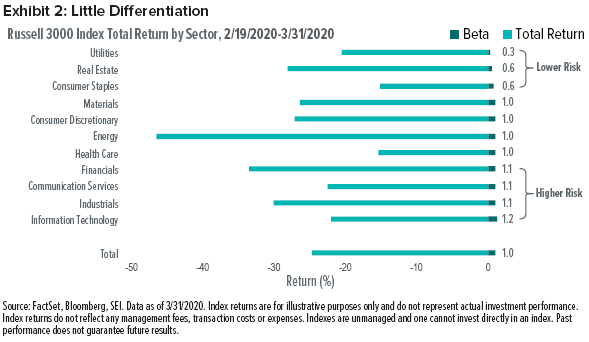
On March 12, 2020, when the Russell 3000 Index sold off by almost 10%, the utilities sector lost slightly more than the market overall—and much more than the information technology sector. In fact, utilities lagged most sectors, including materials, industrials and consumer discretionary that day—and in the very environment that we would have expected the sector to outperform.
It is challenging to find a risk-driven reason to understand why this was the case. Clearly, something was going on in the market during this period that was a differentiator. It does not appear related to risk properties, nor to defensiveness or cyclicality. So then what was it?
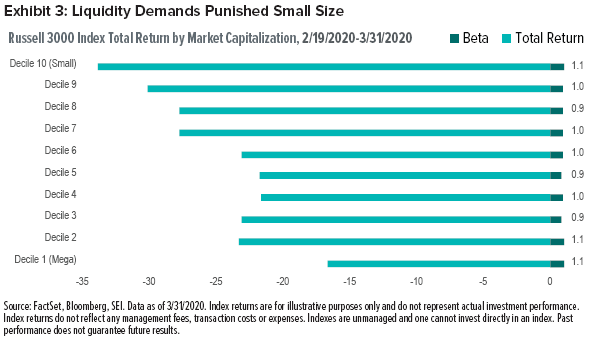
Size looks to have been the differentiator. The Russell 3000 Index can be grouped into deciles by company size. Each decile represents 10% of the market capitalization of the Index. Decile 1 is the largest 10% of the market and includes just three names: Apple, Amazon and Microsoft. At the other end of the spectrum, Decile 10 represents the smallest 10% of the Index. It represents most of the stock count, but only 10% of the weight, and includes small companies that don’t consume much weight in terms of market capitalization.
We can see a strong relationship between company size and return from the high on February 19, 2020 through March 31, 2020 (Exhibit 3). Mega-cap stocks were in a league of their own, and most of the large-cap companies (deciles 2 through 7) also fared better. The mid-cap stocks of the Index (deciles 8 and 9) lagged. Small-cap companies were severely punished, with returns twice as bad as mega-cap returns.
Size, of course, is related to liquidity. And, when the market panics, investors generally seek liquidity and tend to sell at any cost. The smaller the stock, the lower the price a seller must usually offer to entice buyers.
This Has Happened Before
Another example of a surprise shock was after the terrorist attack on September 11, 2001. The Russell 2000 Index (which consists of small-cap stocks) underperformed the Russell 1000 Index (consisting of large-cap stocks) through the end of that month in reaction to an external event as sellers searched for buyers in a forced liquidation. The prices of smaller companies fell further than their large-cap counterparts because of the greater desire to sell relative to the market capitalization of those stocks.
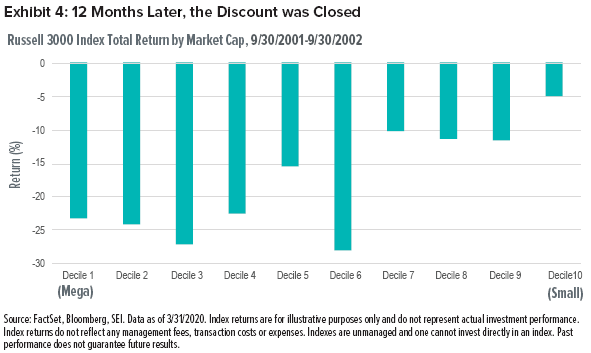
The initial shock of 9/11 turned into a protracted recession. The overall equity market continued deteriorating over the next 12 months. However, the larger-cap stocks suffered substantially more than small caps during this time. Decile 10 of the Russell 3000 Index, which represents the smallest 10% of market cap in the market, outperformed their large-cap counterparts by 15% to 20%.
History leads us to believe that external shocks (such as the one caused by COVID-19) initially produce forced sellers and forced liquidations. When that happens, the less liquid a security is, the greater the impact it has on relative returns. Eventually, discrimination does return, and selectivity and fundamental analysis become more important.
Just because a stock is small does not mean it is overvalued (or overexposed to the current environment). Looking at the past, we see that deeply-discounted securities did get scooped up relatively quickly.
How Can Active Management Benefit?
One common practice in active management is the tendency to underweight the largest companies because market capitalization is one rule that many indexes must follow. The larger (or smaller) the stock is, the larger (or smaller) the dollar allocation is to that stock.
Over the last several years, we’ve seen mega-cap names dominate the market and put pressure on active management. What has happened over the last month is truly extraordinary. Many small- and mid-caps lagged by 15% to 20%, and that has hurt many active managers’ positions. But, as has happened in the past, we believe that dynamic will eventually normalise—and that active management has an opportunity to benefit from it.
Index Definitions
Russell 3000 Index: an unmanaged, capitalization-weighted index that measures the performance of the largest 3000 U.S. companies representing approximately 98% of the investable U.S. equity market.
S&P 500 Index: an unmanaged, capitalization-weighted index that consists of 500 of the largest publicly-traded U.S. companies and is considered representative of the broad U.S. stock market.
Important Information
SEI Investments Canada Company, a wholly owned subsidiary of SEI Investments Company, is the Manager of the SEI Funds in Canada.
The information contained herein is for general and educational information purposes only and is not intended to constitute legal, tax, accounting, securities, research or investment advice regarding the Funds or any security in particular, nor an opinion regarding the appropriateness of any investment. This information should not be construed as a recommendation to purchase or sell a security, derivative or futures contract. You should not act or rely on the information contained herein without obtaining specific legal, tax, accounting and investment advice from an investment professional. This material represents an assessment of the market environment at a specific point in time and is not intended to be a forecast of future events, or a guarantee of future results. There is no assurance as of the date of this material that the securities mentioned remain in or out of the SEI Funds.
This material may contain “forward-looking information” (“FLI”) as such term is defined under applicable Canadian securities laws. FLI is disclosure regarding possible events, conditions or results of operations that is based on assumptions about future economic conditions and courses of action. FLI is subject to a variety of risks, uncertainties and other factors that could cause actual results to differ materially from expectations as expressed or implied in this material. FLI reflects current expectations with respect to current events and is not a guarantee of future performance. Any FLI that may be included or incorporated by reference in this material is presented solely for the purpose of conveying current anticipated expectations and may not be appropriate for any other purposes.
Information contained herein that is based on external sources or other sources is believed to be reliable, but is not guaranteed by SEI Investments Canada Company, and the information may be incomplete or may change without notice.
There are risks involved with investing, including loss of principal. Diversification may not protect against market risk. There may be other holdings which are not discussed that may have additional specific risks. In addition to the normal risks associated with investing, international investments may involve risk of capital loss from unfavourable fluctuation in currency values, from differences in generally accepted accounting principles or from economic or political instability in other nations. Emerging markets involve heightened risks related to the same factors, in addition to those associated with their relatively small size and lesser liquidity. Bonds and bond funds will decrease in value as interest rates rise.
Index returns are for illustrative purposes only, and do not represent actual performance of an SEI Fund. Index returns do not reflect any management fees, transaction costs or expenses. Indexes are unmanaged and one cannot invest directly in an index.
Commissions, trailing commissions, management fees and expenses all may be associated with mutual fund investments. Please read the prospectus before investing. Mutual funds are not guaranteed, their values change frequently and past performance may not be repeated.


