Economic Outlook: Canada: The Good, the Bad and the Ugly (Long Version)
The outlook for Canada is certainly a mixed bag. First, some good news. Although the country’s COVID-19 cases remain elevated during the current wave of infections, daily new confirmed cases are running at only half the rate recorded at the peak of the previous two waves in January and April. Adjusted for population, Canada currently has only one-third the number of daily new cases recorded in the U.S. and one-fifth that of the U.K. Daily new confirmed deaths per million are one-fifth that of the U.S. And Canada’s vaccination rate is now one of the highest of any country; after a slow start, 71% of the population is now fully vaccinated.1
In addition to its strong vaccination rate, Canada’s relative success in containing the virus is largely owed to its comparatively strict lockdowns. According to the Oxford COVID-19 Government Response Tracker, despite recent moves in Canada to ease restrictions, Australia, New Zealand and Italy are the only developed countries with tougher measures currently in place.
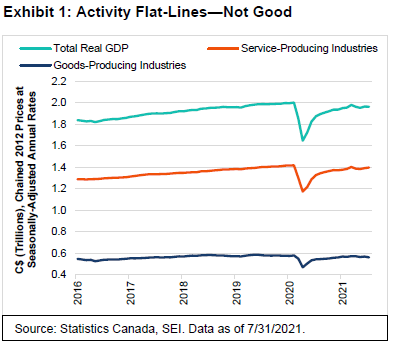
This brings us to some bad news. Canada’s strict lockdowns have affected its inflation-adjusted (real) gross domestic product (GDP), which we track in Exhibit 1. After rebounding sharply between April 2020 and July 2020, GDP growth downshifted to a more measured but still-consistent upward trend. By March 2021, the overall economy was almost back to its pre-pandemic peak. Since then, however, the monthly pattern of growth has been increasingly ragged. Goods-producing industries as of July have shown no improvement since the start of the year. Service-producing industries have registered a moderate 3.2% annualized rate of gain over the same period, but their activity remains below the pre-pandemic peak. By comparison, U.S. real GDP has already achieved a new high, with goods production above its pre-pandemic trend line.
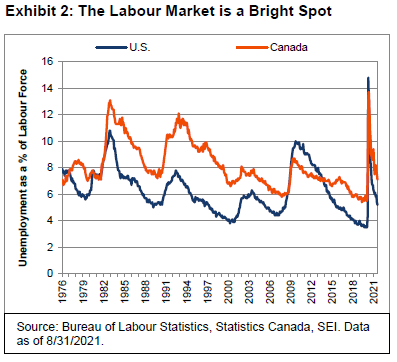
The labour market continues to recover rapidly despite the uninspiring growth this year, as we show in Exhibit 2. Through August, the unemployment rate has dropped to 7.1% from a year-end 2020 level of 8.8%. This is a significant improvement from the peak of 13.7% in May of 2020. However, the U.S. recovery has been sharper, falling from an even higher peak of 14.9% in April 2020 to a jobless rate of 5.2% through August this year—almost two percentage points lower than in Canada. This difference in favour of the U.S. is not at all unusual. Except for the five-year period from 2009 to 2013 that followed the global financial crisis and last year’s springtime era of widespread economic lockdowns, the U.S. typically has enjoyed notably lower levels of unemployment than Canada. Much of this disparity comes down to the greater generosity and inclusiveness of unemployment insurance benefits in Canada versus its southern neighbour.
At SEI, we expect the labour market to tighten further in both countries given the amount of fiscal and monetary stimulus that has been injected since the start of the pandemic.
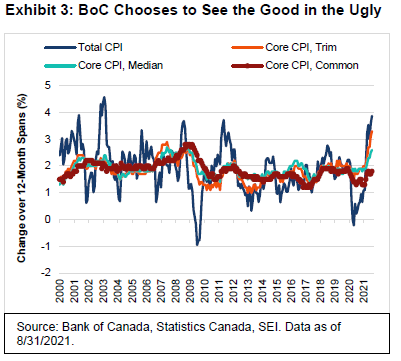
As is true elsewhere, Canada is facing inflation pressures that its central bank and most economists deem transitory. However, all but one of the four major consumer-price measures that we track in Exhibit 3 show dramatic gains for the year-over-year in August; the total Consumer Price Index (CPI), the CPI-trim (which excludes the strongest and weakest 20% of contributors by market weight to the monthly change in CPI) and the CPI-median (which corresponds to the price change located at the center of the distribution) all reached or exceeded their year-over-year high readings of the past two decades.
The Bank of Canada (BoC), however, has chosen to downplay these three measures of inflation in favour of a series called the CPI-common, which tracks common price changes across categories in the total CPI index. The goal of this statistic is to filter out price movements that may be caused by idiosyncratic factors specific to individual components. And what does this measure of inflation show? A modestly rising but still well-behaved inflation rate that remains just under the BoC’s 2% inflation target.
Granted, the pandemic itself and governmental responses to this black-swan event have played havoc with many measures of economic activity. The global supply-chain crisis, which we address at length later in this report, has certainly exerted a powerful and mostly transitory impact on reported inflation rates in Canada and the rest of the world. However, basing policy on the one measure that essentially ignores an inflationary shock of historic dimensions is something we view as quite odd. In any event, the BoC’s focus on the CPI-common makes it amply clear that monetary policy will likely remain expansionary for the foreseeable future. We suspect the central bank will continue to cautiously taper its purchases of securities, but will probably not increase its policy interest rate anytime soon.
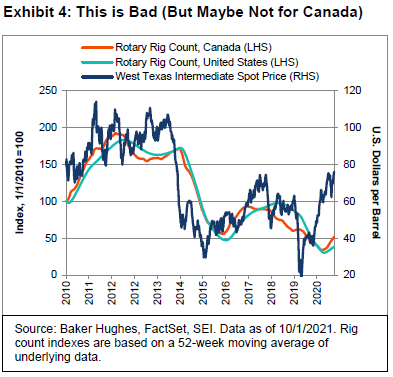
In the meantime, look for those other inflation measures to stay elevated. Exhibit 4 highlights the extraordinary rebound in the price of West Texas Intermediate (WTI) oil since hitting bottom in April 2020. At a recent price of nearly $76 per barrel, WTI is above the peak recorded in 2018 and at its highest level since November 2014. Oil drillers in the U.S. and Canada, however, are not responding to this price incentive as they have in the past. Although the rig count is rising, the actual number of rigs in operation remains well below the levels reached in 2018. Capital discipline has become the new mantra of the oil patch. OPEC+ (Organization of the Petroleum Exporting Countries led by Saudi Arabia, plus Russia) is also showing an unusual cohesion—resisting temptation to hike output more dramatically than the gradual rise in production to which its member countries agreed. Given the fact that oil demand is still well below pre-pandemic levels despite recovering sharply as economies normalize, it is very possible that the oil price will continue to climb in the months ahead. WTI traded above $100 per barrel as recently as 2014; it may approach that level again in 2022 as consuming nations scramble for supplies.
Luckily for Canada, it is a producing nation—not just a consuming one. The energy shortage (and the commodity squeeze generally) should be good news for the country’s equity market. The MSCI Canada Index is heavily weighted toward commodity producers and other cyclical companies, as we show in Exhibit 5. The energy sector makes up about 14% of the Index, while materials and industrials account for approximately 11% and 10%, respectively. The information technology sector, which adds up to nearly 13% of the total Index capitalization, is dominated by one highly volatile stock—Shopify, whose Index weight reached a hefty 8.2% at the end of September.
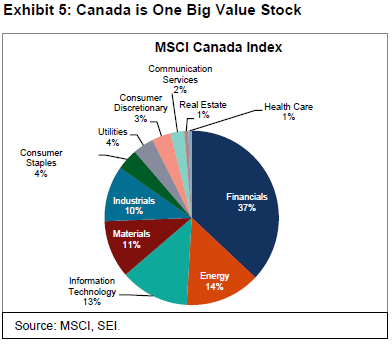
Meanwhile, the financials sector—which contains six of the top-10 companies by capitalization that make up the MSCI Index—accounts for a massive 37% of the MSCI Canada Index. Financials has performed quite well in the year to date, up 24.8% versus 17.5% for the overall index, with only energy and real estate outperforming the sector.
Last year, all companies within the financials sector were hit pretty hard in the first quarter; this included the big banks that dominate the Index as well as asset managers, mortgage lenders and life insurance companies. Once governments announced stimulus measures, the stocks started bouncing back. Banks had previously provisioned for increased loan losses, but ended up not having to realize as much as initially feared. House prices continued to trend higher, and consumers’ debt-service amount appears to be in fairly good shape despite still being higher than in many countries.
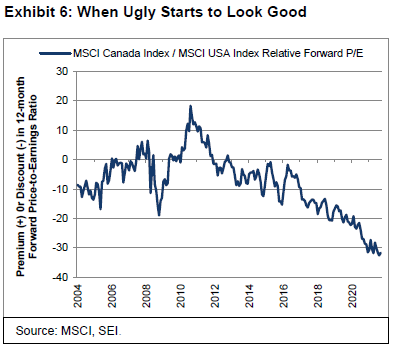
As is the case with other country-specific stock markets with heavy weightings in financials, commodities and industrial companies, Canada’s equity market has the characteristics of a value stock. Exhibit 6 shows how badly the MSCI Canada Index (total return) lagged the MSCI USA Index (total return) over the past decade. But relative performance has held steady in the past year, with the Canadian market managing to keep up with its U.S. counterpart.
Security analysts expect a strong earnings gain for companies in Canada’s market, totalling almost 70% in 2021 versus 46% for the companies that make up the U.S. equity market. In terms of earnings expected over the next 12 months, the MSCI Canada Index (total return) is trading at an abnormally large 32% discount to the MSCI USA Index (total return). Prior to 2018, the valuation discount hasn’t been greater than 20% since 2004. Even something as ugly as that can start to look good.
More Bricks in the Wall of Worry
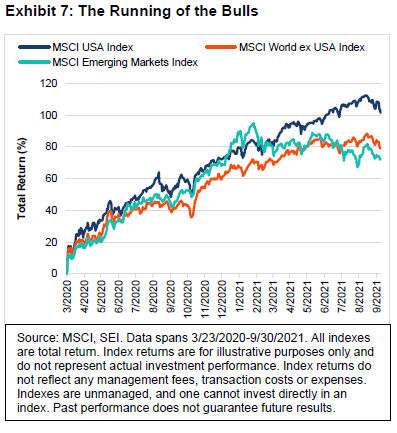
While it has often been said that bull markets climb a wall of worry, seldom have they climbed as high or successfully as the current one. The MSCI USA Index (total return) finished the third quarter of 2021 up 107%, more than doubling the record-low closing it hit on March 23, 2020. Equity market performance outside of the U.S. has not been quite as stellar, but remained impressive through the end of September—with the MSCI World ex USA Index (total return) up 79% and the MSCI Emerging Markets Index (total return) up 72% in U.S. dollar terms.
What has perhaps been more surprising is the relentlessness of the global stock-market rally over the past 18 months. Despite ongoing challenges—such as the repeated waves of new COVID-19 infections around the world; the persistent shortages of goods and labour; the ever-surging inflation rates; and the imminent fading of government economic relief—the bull market has continued its advance.
History indicates that the longer a bull market rally extends, the more complacent investors tend to become. Exhibit 8 takes a look at the term structure of the Chicago Board Options Exchange (CBOE) Volatility Index (known by its ticker symbol, VIX).
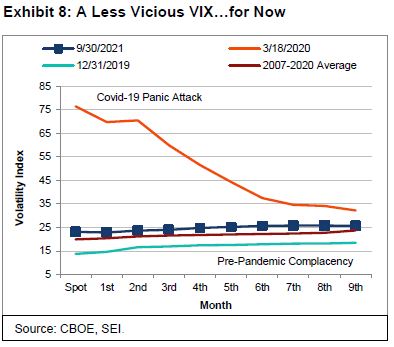
The current VIX futures curve is slightly above the 2007-to-2020 long-term average across the board. The VIX futures curve at the end of the third quarter also was moderately higher across the board compared to the historically low pre-pandemic curve at the end of 2019. While we don’t expect a return to the extraordinary levels reached at the March 2020 peak, we think some rise in U.S. stock-market volatility is likely. Factors behind a near-term rise could include a further easing of U.S. GDP growth amid reduced COVID-related fiscal spending; the tapering of asset purchases by the U.S. Federal Reserve (Fed); the persistent churn of bad news coming out of China; and the seemingly endless congressional battle in the U.S. over infrastructure bills and the debt ceiling.
Investor behaviour seems to support this premise as there have been signs of nervousness beneath the currently placid surface of the market—particularly since COVID-19 infection rates began to surge again in May 2021. In a natural reaction to the prospect of more lockdowns and delayed returns to normal life, investors revisited stocks that benefited the most during 2020—namely the work-at-home, big technology companies and other large-cap stocks that do well when interest rates fall (lower interest rates make future cash flows of these types of stocks more attractive). As a result, growth- and momentum-oriented large-cap stocks have since made a big comeback (as measured by the total-return performance of the S&P 500 Growth and S&P 500 Momentum Indexes); meanwhile the S&P 500 Value Index has given up nearly all the relative ground it gained between September 2020 and March 2021.
At SEI, we do not believe that the recent bounce-back in the growth and momentum styles at the expense of value and cyclical stocks will be a long-lasting one. In our view, economic growth (in the U.S. and globally) should continue over the next year or two at a rate that meaningfully exceeds the sluggish pace of the years that followed the 2007-to-2009 global financial crisis. Even though the COVID-19 Delta variant has proven much more transmissible than the original virus, there is ample reason to believe that the availability of vaccines (particularly with boosters) and improved treatments for severe infections will limit hospitalization and death rates.
In the meantime, the extent of severe COVID-19 cases in the U.S. still compares badly against the rest of the world. As of September 20, there were 213 hospitalizations per million cases—well above almost every other country that reports that particular statistic, including France (118), Israel (114), the U.K. (100), Italy (65), Canada (65) and Spain (63). The seven-day average of daily deaths per million in the U.S. is currently 5.69—also well above the population-adjusted totals in Israel (2.44), the U.K. (1.86), Canada (1.04), Italy (0.88), France (0.87) and Spain (0.70)—and near the top of the list, which includes advanced and developing nations.2
Clearly, there was no summertime reprieve for the U.S. like the one enjoyed last year before the autumn months brought an upward explosion with schools reopening and colder weather driving people indoors. Now there is the danger that severe cases will resume their climb from a much higher base versus this time last year. It remains to be seen whether the availability of booster shots and the declining opposition to getting vaccinated will dampen the current wave of infections. Although cases and hospitalizations have eased off noticeably in recent weeks, we are not convinced that the downward trend will continue.
The U.S. vaccination rate should eventually increase once vaccinations are approved for children between the ages of 5 and 11. President Joe Biden’s mandate for companies with more than 100 employees to inoculate their workforce should also provide a boost (assuming it survives legal challenges). However, it could be weeks or even months before either comes to pass.
The summertime wave of COVID-19 in the U.S. slowed the economy’s upward momentum. Exhibit 9 highlights the Federal Reserve Bank of Atlanta’s GDPNow statistic. It is a running estimate of inflation-adjusted GDP growth based on available economic data for the current quarter.
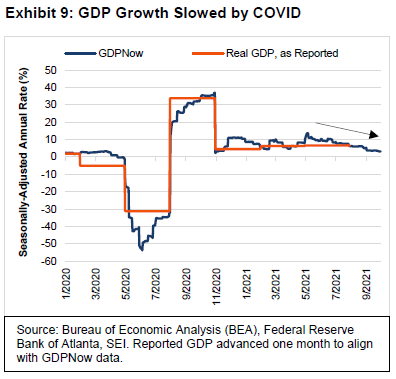
At the beginning of August, this measure suggested that real GDP was on track to grow at a 6.1% seasonally adjusted annual growth rate from the previous quarter. As of September 30, it was signalling an advance of only 3.2% for the third quarter. Growth in personal consumption expenditures (PCE) has decelerated sharply, owing mostly to a downturn in car sales as potential buyers have been turned off by the lack of supply and the extraordinary jump in prices. A drop in business spending on equipment and in residential investment also have contributed to the slowing of GDP growth.
Economic surprises have consistently been to the downside since early July. Citigroup’s Economic Surprise Index (CESI), for example, has fallen deeply into negative territory as the data consistently fell short of consensus expectations. The CESI hasn’t been this low since June 2020, and is at a level that is historically consistent with below-average economic growth.
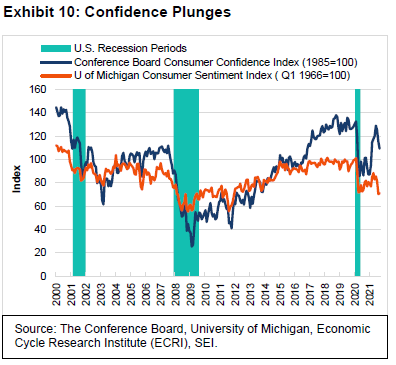
The relative weakness in household expenditures is especially noteworthy at a time when some COVID-19 emergency measures such as enhanced unemployment benefits and the national rent moratorium are ending. The U.S. is facing a “fiscal cliff,” with overall federal government expenditures and transfer payments declining from more than 30% of GDP in the fiscal year that ended in September 2021 to roughly 23% in fiscal year 2022, according to the U.S. Congressional Budget Office. The COVID-19 wave, the reduction in benefits, and the surge in inflation (especially at the gas pump) have combined to dent consumer confidence. Exhibit 10 tracks the two most followed surveys of household sentiment, one from the Conference Board and the other from the University of Michigan. Both measures fell sharply over this past summer.
According to the Conference Board, spending intentions for homes, autos and major appliances pulled back. On the positive side, the same respondents said jobs are easier to get now than any other time in the past 20 years.
The collapse in sentiment reported by the University of Michigan is even more stunning. Excluding the onset of the pandemic last spring, the drop during August was the sharpest since the global financial crisis entered its fiercest phase in October 2008. Monthly declines of a similar magnitude have occurred only three other times (December 1980, August 1990 and September 2005). The first two episodes occurred during economic recessions.
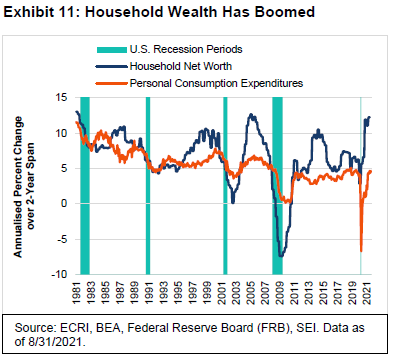
Nevertheless, we suspect all this gloom about flagging U.S. economic growth is a bit overdone. Once the current COVID-19 wave passes, consumers’ spirits probably will revive. First, household wealth is at an all-time high owing to booming stock and home prices. Exhibit 11 tracks household net wealth against PCE (both in nominal terms, which excludes the impact of inflation). We compare these measures over a two-year annualized period to smooth out the gyrations in spending caused by the pandemic. It is easy to see that wealth is usually far more volatile than spending over an economic cycle; however, both tend to move in the same direction. Over the past two years, net worth has grown at a 10% annual rate; the pandemic hardly registers. Consumer spending, of course, was affected to a far greater degree by the disruption in commerce, but only briefly. The change in nominal PCE on a two-year basis is about as healthy as it has been at any time over the past decade.
It’s true that inflation-adjusted disposable income has been contracting since April; however, that pullback is from a level bloated by stimulus payments in January and in March. A big decline in the saving rate has helped cushion the blow to consumer spending. It’s also worth pointing out that saving as a percentage of disposable income remains elevated at 9.4% as of August; in recent years prior to the onset of the pandemic, the saving rate fluctuated between a 7% to 8% range. We think households generally can adjust to the decline in pandemic relief payments without necessitating a sharp contraction in their expenditures. Getting past the current pandemic wave is the key.
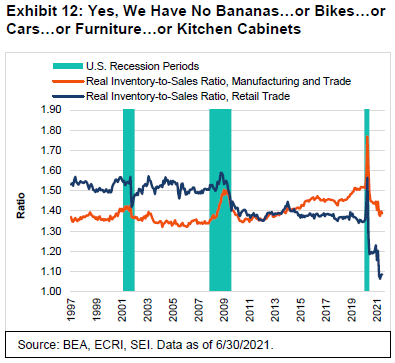
The COVID-19 wave in the U.S. has been restraining consumers’ willingness to spend on restaurants, hotels, air travel, entertainment and other services. It has also had an impact on global supply chains. On the next page, Exhibit 12 highlights how tight inventories are in the U.S. relative to demand. This is especially the case at the retail level. The Delta variant has upended production in several Southeast Asian countries including Vietnam, Thailand, Indonesia, Malaysia and the Philippines. At the other end of the supply chain, U.S. ports are clogged with ships that are unable to unload their cargo due to a severe trucking shortage.
As we show in Exhibit 13, vendor deliveries have seldom been as slow in the 74-year history of the Institute for Supply Management’s (ISM) survey as they are now.
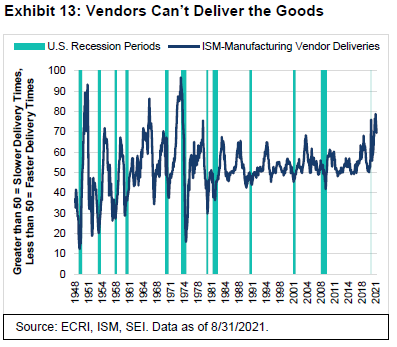
Although the situation has eased slightly since May, Purchasing managers in 16 broad industry groupings still reported slower deliveries in August versus the previous month. This includes five of the top-six industrial sectors covered by the survey (fabricated metal products, food, beverage and tobacco, computers and electronics, chemicals and transportation). The runoff in inventories clipped annualized real GDP growth by 2.6 percentage points during this year’s first quarter, and by another 1.3 percentage points in the second quarter. While the final report for this past quarter is expected to show that the contribution to change in GDP flipped to the positive side of the ledger, inventories remain exceedingly low relative to demand. We think it best to tackle holiday shopping early this year.
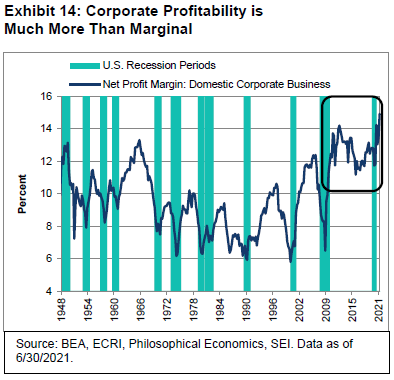
Equity investors are not blind to the challenges facing companies. To be sure, sales opportunities have been lost to low inventories or lack of personnel to produce goods and services. At the same time, input costs are rising rapidly. Companies have been able to compensate by passing along their increased costs to customers. Exhibit 14 shows that after-tax corporate margins on an economy-wide basis hit a new all-time high in the second quarter, rising to 14.9% of sales. As we highlight in the chart, corporate profit margins have been relatively robust since the end of the global financial crisis in 2009. Even in the midst of the short-but-sharp pandemic-induced recession, margins remained within the range of the past 10 years and well beyond most cyclical peaks recorded since 1948.
Corporate pricing power is the good news. The bad news is that inflation keeps exceeding consensus expectations. It has been our position at SEI that inflation will run at a higher rate for a longer period than commonly assumed. This period of outsized price gains may still be transitory in the sense that it need not deteriorate into the kind of self-feeding wage-price spiral that occurred in the second half of the 1960s and throughout the 1970s. Still, inflation expectations still seem low given the cautious commentary coming from companies grappling with supply-chain and human-resource issues.
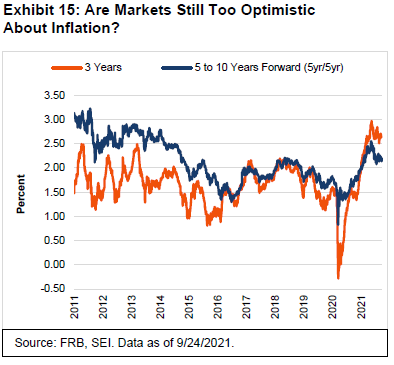
Exhibit 15 examines inflation expectations, as measured by the yield on inflation swaps—that is, financial derivatives in which investors swap a fixed payment for payments based on the consumer price index (CPI). These swap instruments extend from one to 30 years. In the chart, we focus on the three-year and five-year/five-year forward swap (the latter series measures inflation compensation five to 10 years into the future). Both tend to run together quite closely; the three-year yield is a bit more volatile, reflecting its stronger correlation to the movements of the current inflation rate. Although inflation expectations have been rising since the economy hit bottom in the spring of 2020, we think investors are still underestimating future inflation—not just over the next one or two years, but well into the decade. In our view, it is possible that annualized CPI inflation could run half a percent or more than the 2.6% currently priced into markets over the next three years and the 2.2% over the next five to 10 years3.
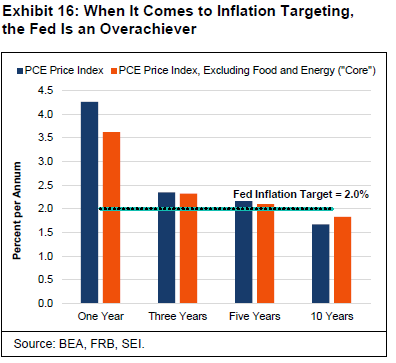
Actual inflation over the past 12 months has been running at more than twice the pace reflected in expectations for the next two or three years. Exhibit 16 compares the PCE Index—the Fed’s preferred measure of inflation——over one, three, five and 10 years. PCE inflation has risen at such a strong pace over the past 18 months that both the overall index and the core PCE Index (which excludes food and energy prices) now exceed the central bank’s target of 2% inflation over the past one-, three- and five-year periods.
Fed Chairman Jerome Powell and the other members of the Federal Open Market Committee (FOMC) have been as surprised as most economists when it comes to the magnitude and persistency of the inflation acceleration. Nevertheless, the central bank is still firmly wedded to the inflation-is-transitory thesis. In its quarterly projections issued on September 22, the Fed increased the 2021 median estimate for PCE inflation to 4.2% from its June projection of 3.4%. It also nudged up estimates for 2022 (by 0.2% to 2.3%) and 2023 (by 0.1% to 2.2%). The Fed’s latest forecast includes an initial estimate for 2024 of 2.1%.
Although the inflation rate may have peaked, there is no guarantee that it will head all the way back below 3% any time soon. Supply-chain issues are expected to continue to constrain production well into 2022, especially for computer chips. Moreover, labour costs could become an even bigger issue for companies in the year ahead. Even if COVID-19 fades as a concern, it may remain difficult to find personnel to fill the jobs available. Exhibit 17 on the following page compares unit labour costs against the core PCE Price Index over three-year annualized periods. Taking a three-year view has the double virtue of smoothing out the volatility of the two measures and reducing the impact of gyrations specifically related to last year’s pandemic lockdown and restart.
The change in unit labour costs equals the change in total labour compensation per hour within the nonfarm business sector minus the change in productivity (output per hour). We view the change in unit labour costs as the basic building block behind the ups and downs of inflation. When the economy emerges from recession, growth in unit labour costs typically slows in significant fashion. That’s because labour compensation eases at the bottom of the economic cycle and during the early stages of recovery, reflecting high unemployment that limits workers’ bargaining power. Productivity, meanwhile, tends to improve rapidly from the economic low point as output per hour increases faster than employment growth. Following the 2001 and 2007-to-2009 recessions, unit labour costs actually dropped into negative territory due to weakness in compensation more so than strength in productivity.
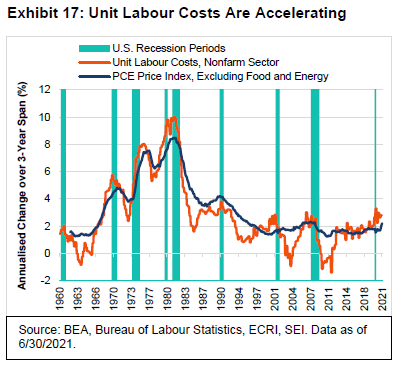
Something different is happening now. Hourly compensation is heading higher in a worrisome way. Measured over a three-year period, it is running at a 5% annual rate, close to the previous cycle highs of the past 30 years. Labour productivity is also rising, but is lagging far behind compensation growth on the same three-year annualized basis. As a result, unit labour costs are running near a 2.7% annualized rate—the fastest pace since the 2002-to-2007 expansion peaked. While commodity inflation and parts shortages may indeed prove transitory, it is not clear whether the labour shortage and the resultant pressure on compensation growth will be as quick to revert to lower levels. Perhaps productivity growth will come to the rescue as companies seek ways to minimize the need for labour through robotics and artificial intelligence, but that will not be a quick fix. In the meantime, the tax and regulatory initiatives of the Biden administration will likely add to the cost pressures facing businesses in the years immediately ahead.
Since U.S. demand is expected to remain robust as economic growth normalizes, it would not be at all that surprising to see companies maintain their profit margins as best they can by continuing to pass along their increased costs. Sustained inflation over the long haul could thus be closer to 3% than the rate of about 2% presently expected by the Fed and most investors. If that turns out to be the case, the current yield structure may also prove to be unsustainably low; a 10-year Treasury bond in the 2%-to-2.5% range may make more sense. In the next couple of years, rates could stay suppressed at lower levels owing to Fed policy. There’s a chance that the central bank’s tapering of bond purchases expected before year-end or early next year will exert some upward pressure on yields. We suspect, though, a shift in interest-rate policy will need to take place before bond yields are substantially affected.
At this point, decision-makers at the Fed appear evenly split about whether to start raising rates next year or in 2023. FOMC members envision a 1% federal-funds rate by the end of 2023, and a 1.8% rate by the end of 2024. These projections remain well below the central bank’s long-run equilibrium projection of 2.5%. The upward trajectory of the policy-rate increases are also much slower than has historically been the case. If we are correct in our assessment about inflation, the Fed may be forced to raise interest rates higher and faster over the next three years than they have currently pencilled in.
Another concern, which is much nearer in timeframe, is the fight in Washington over infrastructure spending and the debt limit. As expected, the push to dramatically increase spending on climate change and social services, paid for by a sharp increase in taxes on corporations and upper-income households, has run into opposition—not just from Republicans, but from a small-but-crucial coterie of Democrats from both chambers of Congress. It is our working assumption that President Biden will get about half of what he is seeking; but the devil will be in the details. Investors are probably right not to react too dramatically to every turn in the torturous process.
The debt-limit drama, however, could elicit a more significant reaction as the deadline for must-pass legislation nears. Exhibit 18 highlights the fact that the debt limit has either been suspended or allowed to automatically increase automatically since 2013.
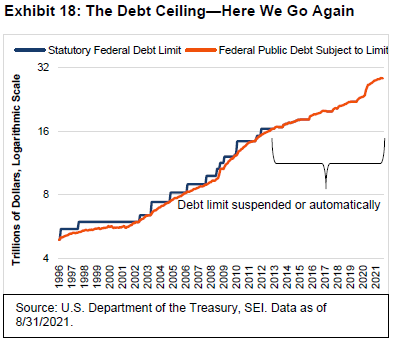
Two years earlier in 2011, the battle over the debt ceiling took on a new dimension as a newly assertive Republican majority in Congress pushed back hard against the fiscal priorities of the Obama administration. The standoff forced a temporary shutdown of many government activities; it also raised the possibility of a technical default of some Treasury issues. This spawned a sharp selloff in equities and other risk assets in August of that year, and a downgrading of the U.S. credit rating by Standard & Poor’s.
If anything, the political atmosphere in Washington is more toxic today than it was 10 years ago. Although the debt ceiling will almost certainly be raised, the wrangling over it will likely come down to the wire. All things considered, the harsh reaction of the stock market in 2011 most likely will not be repeated. But we can’t rule out some sort of temporary market disruption in response to a technical default on the federal government’s payment obligations.
We suggest keeping one’s focus on longer-term considerations: The COVID-19 wave will eventually pass. Economic growth should stay relatively strong in 2022. Households are in solid financial shape and will benefit as employment and wages continue to move higher. Companies are still able to pass along their increased costs and maintain their high profit margins. Fed policy is still biased toward easing, allowing the economy to run hot at the risk of higher inflation. All of this should be a favourable backdrop for risk assets and allow for a resumption in the coming months of the cyclical/financial/value trade versus growth/technology as we saw earlier this year.
Following the U.S. Lead
Other developed countries are broadly on the same path as the U.S., and reacting to the same catalysts. Exhibit 19 tracks the composite purchasing managers’ indexes (PMI), which generally cover the activities of manufacturing, services and construction companies, for a selection of advanced industrial countries and regions. Prior to the pandemic and during its initial stages that brought economic activity to a screeching halt, developed countries were more-or-less in sync with each other. While the U.S. did not experience as deep a trough in activity as Europe or Canada, that merely reflected the fact that much of the U.S. remained open for business (even as the Northeast and California enacted relatively strict pandemic protocols and shelter-at-home regulations).
The rebound from the trough during the spring and summer months of 2020 was dramatic for most advanced economies; but the COVID-19 wave that hit during the fall and winter knocked the wind out of their proverbial sails, with the U.S. being a notable exception. As we’ve noted on several occasions, the U.S. has taken a different approach to dealing with the virus compared to many other countries, allowing a lot more movement and avoiding the lockdowns that have been so prevalent elsewhere. Of course, as we detailed earlier in this report, this more permissive tack has come at the cost of higher caseloads, hospitalizations and deaths. More aggressive fiscal and monetary actions in the U.S. compared to other countries also played an important role in keeping consumer spending exceptionally buoyant.
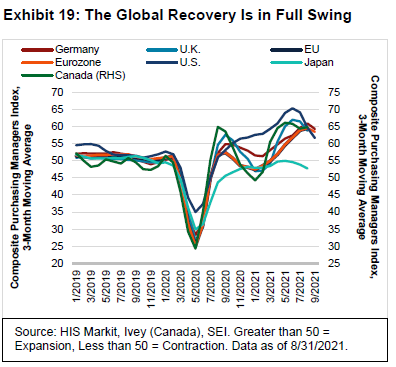
Purchasing managers’ surveys from recent months show that U.S. economic growth is coming off the boil; although the level of activity remains strong versus the period leading up to the pandemic. As we mentioned, this easing of growth has coincided with the summer upsurge in the Delta variant. By contrast, Europe, led by Germany, appears to be on the upswing; a decline in infections has allowed for more travel and tourism in Europe, while the increase in EU fiscal support has also helped to boost to activity.
The major outlier in Exhibit 19 is Japan. Its composite PMI reading in August was below 50, indicating a decline in overall economic activity. As it is, the Japanese economy has been rather weak so far this year versus its industrial-country peers. Inflation-adjusted GDP fell in the first quarter and posted only a tepid gain in the second quarter. Economists blame the drop on COVID-19-related restrictions. The chip shortage, meanwhile, has impeded auto production. Citizens nonetheless blamed Japanese Prime Minister Yoshihide Suga; they were also furious with his decision to host the Tokyo Olympics as scheduled despite the nation-wide flare-up in infections caused by Delta variant. In response, the Prime Minister announced in early September that he would not run for re-election as head of the Liberal Democratic Party (LDP). The party’s next leader, former foreign minister Fumio Kishida, is expected to also succeed Suga as prime minister once elections are held in November.
As in the U.S., the challenges posed by COVID-19 and the disruptions to production have pushed inflation in various countries to levels not seen in many years. Exhibit 20 highlights the harmonized index of consumer prices (HICP), which provides a more comparable measure of different countries’ inflation rates than their individually issued consumer-price statistics. The HICP for the U.S., for example, excludes the costs of owner-occupied housing. Under the HICP methodology, the rental-equivalent cost for owner-occupied housing is considered an investment, not consumption, so is left out of the calculation; only the actual cost of renting is included. In any event, Exhibit 20 shows that the U.K. has tended to be more inflation-prone over the past decade than the rest of Europe and even the U.S.
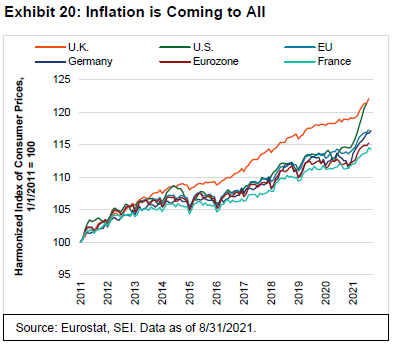
Inflation has accelerated around the globe in the past year, although the increase has been much more dramatic in the U.S. than elsewhere. On a year-over-year basis, the HICP measure surged almost 6% in the U.S. versus 4.7% for Germany, 3.0% in the U.K. and 3.6% in the EU. More than a percentage point of the difference between the U.S. and other regions comes from the soaring price of used cars and trucks. Some industries in the U.S.—primarily within services (hotels, apparel, airfare, restaurants and catering)—are seeing prices rise faster compared to other parts of the world. Once again, this reflects an earlier economic reopening in the U.S. economy compared to Europe.
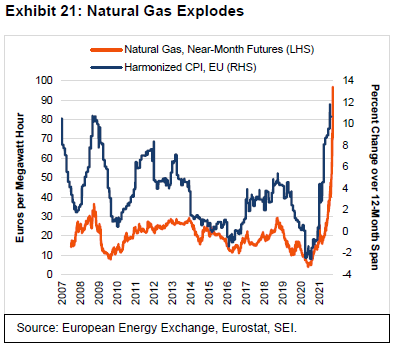
Inflation in the U.S. may be near a peak, but a further acceleration appears to be in store for Europe. The immediate concern for households in the region is the cost of energy. As we show in Exhibit 21, natural gas prices have already soared on the Continent, with shortages preventing the typical addition to reserves ahead of the winter season. Meanwhile, consumer electricity prices were pushed up a cumulative 12% between May 2020 and August 2021 due to the combination of reduced gas supplies from Russia and Norway, fewer liquefied natural gas imports from the U.S., and a drop in electricity production from windmills.
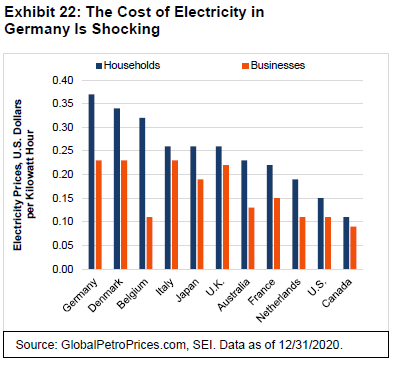
And, as we highlight in Exhibit 22, even without these shortages, electricity prices tend to be much higher across Europe than in North America, especially for households. German households are especially vulnerable; at the end of last year, they paid an average of $0.35 per kilowatt hour for their electricity compared to a national average of $0.15 for U.S. consumers.
The U.K. has also been suffering from a gasoline crisis as consumers there face long queues at the petrol pump. This isn’t because wholesale gasoline is in short supply. Rather, there has been an inability to deliver supplies to the gas stations as a result of a severe truck driver shortage.
Europe’s energy woes probably won’t cause the region’s governments to deviate from the climate-change agenda they have put in place. The recent German election underscores this point. Although it will take a couple of months to cobble together a coalition, all political parties there are committed to reducing carbon admissions. Our bet is that the left-of-centre Social Democratic Party will head a coalition with the Greens and the pro-market Free Democrats parties. But even the right-of-centre Christian Democratic Union of Germany is on board with the broad climate policies that will continue to be put in place.
Beyond energy, the reopening of the European economy should cause the price of services to rise as they have in the U.S., albeit to a far more limited extent. In its latest macroeconomic report, the European Central Bank’s staff projections see headline HICP inflation for the eurozone peaking at 3.1% in this year’s fourth quarter before decelerating to an average 1.7% in 2022 and to 1.5% in 2023. Other forecasters (the International Monetary Fund, Consensus Economics, and the Survey of Professional Forecasters, to name three) have similar consumer-price projections. The overwhelming assumption is that any pick-up in inflation will be short-lived, and that it will return relatively quickly to its low pre-pandemic trend. These forecasts already are badly out of date, given the fact that headline inflation in the eurozone is up 4.1% over the 12 months ended September 30, according to Eurostat.
The same questions apply to the rest of the developed world as they do to the U.S. Will inflation prove as transitory as the PhD economists at the world’s major central banks insist? Or will the shortages in goods and labour prove more persistent and begin to permeate the expectations of investors, workers and corporate managers? As we previously noted, longer-term inflation expectations still appear well-anchored and are keeping U.S. bond yields relatively low.
Exhibit 23—which compares the quintiles of developed-market stocks (excluding the U.S.) that are most and least correlated to the U.S. bond market—shows that it’s not just U.S. equities that key-off the U.S. 10-year Treasury bond. The 20% of the market with the highest correlation to U.S. Treasury bond returns now sports a forward price-to-earnings ratio that trades at a 70% premium to the forward multiple of the overall U.S. market; the bottom 20% of non-U.S. stocks trade at a 40% discount on the same forward-multiple basis.
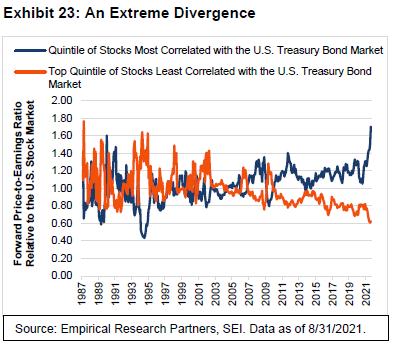
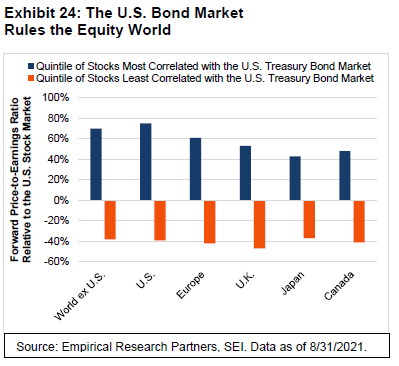
Exhibit 24 looks at the most recent valuations on a country basis. Note that the U.S. stock market is little different from the rest of the major markets when it comes to relative performance and extreme valuations. The bottom line is that investors appear convinced that interest rates will remain at rock-bottom levels for a long time to come. If bond yields push higher over time, the cohort of stocks most correlated with bonds could face a de-rating of their earnings multiples despite their solid company fundamentals.
Emerging Markets: Will China Be Ever Grand Again?
China is sucking all the oxygen out of the room when it comes to investor perceptions of emerging markets. The push by President Xi Jinping’s government to enforce “common prosperity” within the country has had far-reaching effects on corporate China, beginning with the cancellation of Ant Group’s initial public offering last November. Since then, the bureaucrats have flexed their regulatory muscles against publicly traded social media companies, ride-hailing providers, tutoring companies, online-gaming companies, Macau casinos, and even entertainment celebrities. Most recently, the government banned transactions in crypto currencies and the mining of them. Chinese real-estate developer Evergrande’s path toward outright default was greased by financing rules announced last year (the “Three Red Lines”) that tightened lending and capitalization standards, effectively capsizing the company’s aggressive business model.
SEI recently published two reports on these developments4 so there is no need to go into a great detail here. However, it is important to understand the context of these moves and their impact. First, it is crystal clear that President XI Jingping will not allow the creation of any power centres that could threaten the political and economic primacy of the Chinese Communist Party. Second, it is possible that China is being put on a “war-footing” in anticipation of a further deterioration in U.S.-China relations. Advances in consumer-oriented technology industries (such as social media and gaming) mean nothing—Xi plainly wants the best talent to concentrate on the technologies that will advance China’s industrial and military strength. Third, the country’s 20-year economic boom has exacerbated social inequality. The crackdown on for-profit tutoring companies and major gig employers (such as ride-hailing app Didi and online shopping platform Meituan) as well as on individuals (notably, Chinese business magnate Jack Ma) is a brutal but effective way of directly addressing some of the country’ wealth and income disparities.
Although some of these moves have hurt foreign equity investors, it’s unclear whether the economy itself will be severely constrained. China is a huge country with tremendous internal capital upon which to draw. The attempt to eliminate real-estate speculation can plausibly be interpreted as an attempt to divert household savings away from property in order to fund capital development in those areas favoured by the government. It isn’t likely that foreign companies are going to cut and run, but they will certainly be forced to play by Beijing’s rules if they stay.
At the margin, we should see diversification of supply chains away from China, but this has been happening anyway. For example, it is in the U.S. and other advanced countries’ interests to bring semiconductor production back on shore (where feasible) and to be more self-sufficient in other critical areas such as personal protective equipment and COVID-19 testing kits, which China hoarded during the early months of the pandemic at the expense of the rest of the world. But China is too big, too efficient and too important a manufacturer for the world to completely turn its back on.
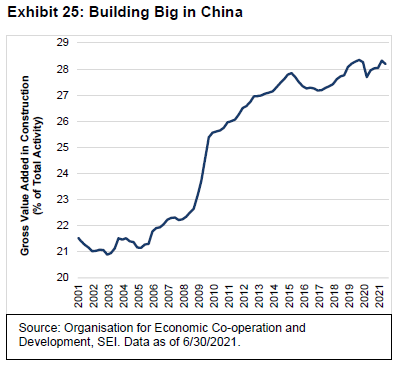
China’s growth rate should nevertheless slow as a result of the government’s actions. For the past 15 years, property development has been the driving force behind the country’s rapid economic growth, as we show in Exhibit 25. The surge in construction as a percentage of total gross value-added leapt from 21% in 2005 to over 28% in 2021. This rise has coincided with a huge expansion of debt. All of the money that flowed into the real-estate sector has stoked periodic booms and busts—along with a great deal of wasted resources including “ghost” cities and high-speed trains to nowhere. Critics of China’s economic model have wondered for years if the bill would ever come due. It might be coming due now.
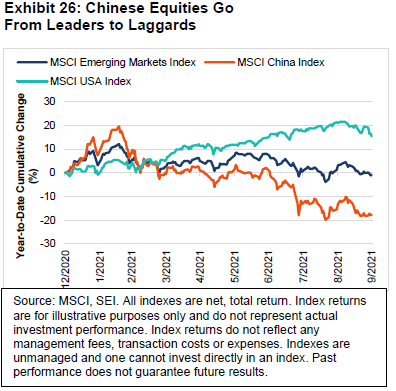
Evergrande’s woes sparked only the briefest amount of volatility in global financial markets during September. On the following page, Exhibit 26 tracks the performance of Chinese equities, as measured by the MSCI China Index (total return) versus the MSCI Emerging Market Index (total return) and MSCI USA Index (total return). China’s stock market has fallen sharply from its surprisingly fast start to 2021, and is now down almost 20% on a year-to date basis. The MSCI Emerging Markets Index performance is flat for the year to date. Although the MSCI Emerging Markets Index (total return) lags the U.S. by a substantial amount, its resilience in the face of China’s stock-market tumble is impressive—especially considering that China accounts for a significant portion of the Index (almost 34% at the end of August 2021).
At SEI, we are watching the trend in commodity prices for hints that pressure on China’s construction activity is beginning to reverberate beyond its borders. The country’s voracious demand for steel, copper and other raw industrial metals could decline as construction activity fades in importance. So far, there has been little sign of that occurring. Iron ore prices have plunged sharply in recent months, for example, but the 45% tumble from the July peak appears to have been caused primarily by government-mandated closures of steel plants in an effort to cut down on pollution.
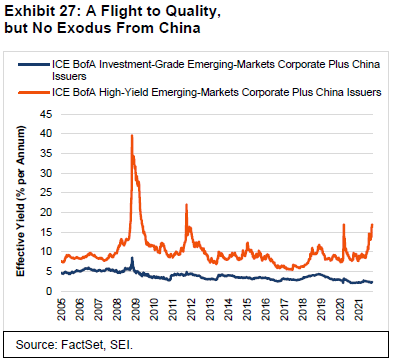
Even within China itself, investors seem to be taking the Evergrande debacle in stride. Exhibit 27 compares Chinese investment-grade bonds versus their high-yield counterparts. The effective yield on the country’s high-yield bonds have been rising sharply since May, and it is now nearly as high as it was in March 2020. While the effective yield on these bonds may climb further in the weeks ahead, it will still be nowhere near the 40% yield reached in the midst of the global financial crisis back in 2008. It also remains some five percentage points below the high reached in 2011, when the government was clamping down on excessive credit growth and rampant speculation in the property and stock markets. In contrast to high yield, investment-grade fixed-income securities have enjoyed a further easing in yield. There is no sign whatsoever of contagion. At an effective rate of 2.34%, the yield on investment-grade bonds in China is currently near its lowest level in the past 20 years.
One explanation for the resiliency of the MSCI Emerging Markets Index is the strength of the global economy outside China. The U.S. has been leading the way, but other advanced countries, notably Europe, continue to post improvement in economic activity. The Delta variant may be acting as a speed bump for these economies, but the earnings of publicly traded companies generally remain robust; we believe that analysts are still underestimating that strength. Exhibit 28 compares the growth rates of select countries and regions, including the companies in the MSCI Emerging Markets Index.
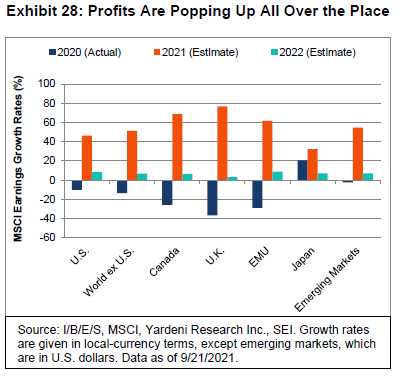
With the exception of Japan, all earnings estimates for 2021 have been raised dramatically versus just six months ago. Forecasts for 2022 earnings have been cut in half from where they were six months ago, but they still are expected to show mid-to-high single-digit gains. It is entirely possible that this lowering of the bar for next year will allow for upward revisions in analysts’ earnings estimates—assuming, as SEI does, that the renormalization of global economic growth gets back on track as vaccines are more widely distributed across the globe and the Delta variant fades into the background.
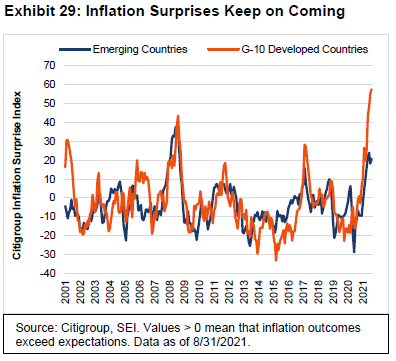
Besides China, emerging economies face another challenge—inflation. Exhibit 29 highlights Citigroup’s inflation surprise index and the extent to which inflation has exceeded expectations this year. Mostly owing to acceleration in the U.S., inflation in the G-10 (largest developed) countries has soared, on average, relative to market expectations. If history is any guide, emerging economies will also continue to surprise on the upside over the next few months. South America, which has traditionally been an inflation-prone region, has witnessed a particularly worrisome acceleration in consumer prices in recent months. As of August, the year-over-year price increase in Brazil, the region’s most significant economy, amounted to nearly 10%—almost double the annual pace recorded six months prior.
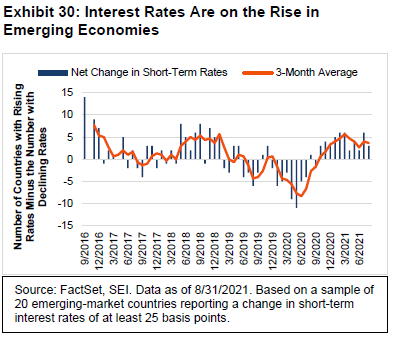
Unlike advanced countries, where inflation expectations tend to be better anchored, central banks in vulnerable emerging economies are sometimes forced to raise interest rates sooner than they would prefer in order to dampen inflation pressures and defend their currencies. Exhibit 30 tracks the net number of countries recording a rise or fall in short-term interest rates of one-quarter or more of a percentage point in a given month. We show a sample of 20 emerging-market economies for this exercise. On balance, more countries have seen a rate increase in each of the past 12 months. During the first nine months of 2020 as the pandemic pushed the world into recession, most emerging economies were reporting declining yields while developing economies benefited from the tsunami of liquidity pumped into financial markets by the Fed and other major central banks. Countries with a rising interest-rate trend include Brazil, Chile, Mexico, Peru, the Czech Republic, Hungary and Russia. The central banks of Brazil and Russia have been particularly aggressive, raising their policy rates as inflation in both countries climbs to troublesome levels.
Given these concerns, one might be tempted to avoid the asset class altogether. But we think that would be a mistake. Valuations, especially relative to the developed world, look especially cheap. Exhibit 31 compares the forward price-to-earnings ratios of the MSCI Emerging Markets Index to the MSCI World Index.
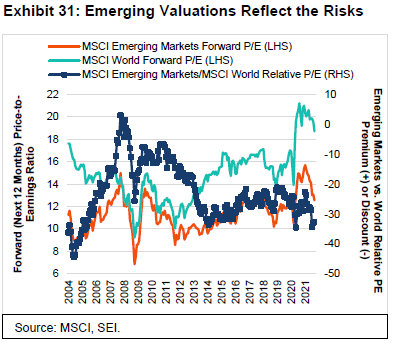
Although the multiple applied to emerging-market equities (12.5 times the estimated earnings of the next 12 months) looks expensive against the historical record, the forward price-to-earnings ratio of the MSCI World Index is exceptionally high compared to the past 17 years. On a relative basis, emerging-market equities are trading at a 33% discount to those of developed countries. That relative multiple is at the low end of the past decade. We think investors are being paid to take the risk inherent in emerging markets. But if there is a case to be made for active investing as opposed to passive investing, it can be found in spades in emerging equity.
What actions are our portfolio managers taking?
In our domestic equity portfolios, the energy sector was underweight as a whole but overweight energy exploration and production companies, which have benefited from increasing energy prices. Similarly, while information technology remained underweight due to the large benchmark weight of Shopify, managers held overweight positions in a number of individual companies that they view as relatively attractive within the sector.
Within U.S. equities, our positioning at SEI remained fairly consistent in the third quarter. We have maintained our view for some time now that value-oriented and high-quality stocks are trading at attractive valuations, especially relative to more speculative growth stocks. Value has started to perform better this year, but in an uneven and choppy manner. Year to date, growth has still outperformed among larger companies while value has been the clear winner among smaller companies. Active managers tend to underweight the largest mega-cap stocks, and our strategies are quite true to that label. Active management has been beneficial during the quarter; we believe market conditions will provide additional opportunities going forward.
Within international equity markets, we have been actively seeking to increase the value tilt at the expense of quality and momentum stocks. These changes have been modest thus far and are directionally in line with prior positioning. We have observed that value has become less cyclical in nature, exhibiting more quality factors of late.
In Asia and emerging markets, small-cap emerging markets outperformed large-cap counterparts; our positioning benefited from this during the quarter, as did an underweight to Chinese ecommerce companies. Southeast Asia (Philippines, Thailand, Malaysia) outperformed other emerging countries in the region during the quarter, supporting our supposition that value may be picking up in these areas as vaccination rates climb. As value performs better it will likely exhibit more characteristics of momentum. As such, we expect some rotation into value from our momentum managers and, therefore, a potentially significant increase in value exposure.
The Canadian yield curve did not change much during the last three months. The most recent headline inflation figure came in at 4.0%, with the 5-year breakeven rate at 1.99%. We believe we are seeing transitory inflation effects, mostly from commodities. There were no significant changes within our domestic fixes-income portfolios during the quarter. We are overweight corporate credit and underweight duration and spread duration.
U.S. high-yield bonds continued to perform well on the back of the recovery in the energy sector. The market appears fairly healthy, with strong new issuance, no refinancing issues, and low default rates. Managers continued to look for securities that are upgrade or acquisition candidates, two events that we believe typically lead to outsized bond returns.
Glossary
Bull market refers to a market environment in which prices are generally rising (or are expected to do so) and investor confidence is high.
Cyclical stocks or sectors are those whose performance is closely tied to the economic environment and business cycle. Managers with a pro-cyclical market view tend to favour stocks that are more sensitive to movements in the broad market and therefore tend to have more volatile performance.
European Union (EU) is a group of 27 countries that operates as a cohesive economic and political block. Nineteen of the countries use the euro as their official currency.
Growth stocks exhibit steady earnings growth above that of the broader market.
High-yield bonds are rated below investment grade and are considered to be riskier.
International Monetary Fund (IMF) promotes international financial stability and monetary cooperation. It also facilitates international trade, promotes employment and sustainable economic growth, and helps to reduce global poverty. The IMF is governed by and accountable to its 190 member countries.
Investment-grade bonds are Bonds that are believed to have a lower risk of default and receive higher ratings by the credit rating agencies.
Issuance is the sale of securities, typically with regard to debt instruments such as bills, notes and bonds.
Momentum refers to a trend-following investment strategy that is based on acquiring assets with recent improvement in their price, earnings, or other relevant fundamentals.
Price-to-earnings (P/E) ratio is the ratio for valuing a company that measures its current share price relative to its per-share earnings (EPS).
Standard deviation refers to a formula used to calculate the historical volatility of performance.
Taper tantrum describes the 2013 surge in U.S. Treasury yields resulting from the Federal Reserve's announcement of future tapering of its quantitative-easing program.
Yield curves represent differences in yields across a range of maturities of bonds of the same issuer or credit rating (likelihood of default). A steeper yield curve represents a greater difference between the yields. A flatter curve indicates that yields are closer together.
Value stocks are those that are considered to be cheap and are trading for less than they are worth.
Index definitions
The Bloomberg Barclays EM Local Currency Government Index measures the performance of local-currency emerging-market sovereign debt.
The Bloomberg Barclays US Aggregate Bond Index is a market-value-weighted index consisting of investment-grade, fixed-rate debt issues (including government, corporate, asset-backed, and mortgage-backed securities), with maturities of at least one year.
The Citigroup Economic Surprise Index measures data surprises relative to market expectations. The index was designed for currency trading and its signals may not be relevant to other financial instruments. A positive (negative) reading means that data releases in the prior three months have been stronger (weaker) than expected.
The Citigroup Inflation Surprise Index measures the level of actual inflation compared with inflation expectations.
The Composite Purchasing Managers Index is an indicator of economic health for manufacturing and service sectors. Its purpose is to provide information about current business conditions to company decision makers, analysts and purchasing managers.
The Conference Board Consumer Confidence Index is an economic indicator published by The Conference Board to measure consumer confidence, defined as the degree of optimism on the state of the U.S. economy that consumers are expressing through their activities of savings and spending.
The Consumer Price Index measures changes in the price level of a weighted average market basket of consumer goods and services purchased by households. A consumer price index is a statistical estimate constructed using the prices of a sample of representative items whose prices are collected periodically.
The Commodity Research Bureau (CRB) Raw Industrial Commodity Price Index is a measure of price movements of 22 sensitive basic commodities whose markets are presumed to be among the first to be influenced by changes in economic conditions. It serves as one early indication of impending changes in business activity.
The Employment Cost Index is a quarterly economic series published by the Bureau of Labour Statistics that details the growth of total employee compensation. The index tracks movement in the cost of labour, as measured by wages and benefits, at all levels of a company.
The ICE BofA Emerging Markets Corporate Plus Index tracks the performance of U.S. dollar and euro-denominated emerging-market non-sovereign debt publicly issued within the major domestic and eurobond markets.
The ICE BofA Investment Grade Emerging Markets Corporate Plus China Index tracks the performance of U.S. dollar and euro-denominated emerging-market investment-grade debt publicly issued within the major domestic and eurobond markets and including China.
The ICE BofA High Yield Emerging Markets Corporate Plus China Index tracks the performance of U.S. dollar and euro-denominated emerging-market high-yield debt publicly issued within the major domestic and eurobond markets and including China.
The ICE BofA High Yield B Index is a capitalization-weighted index of U.S. dollar-denominated below-investment-grade corporate debt rated B and publicly issued in the U.S. domestic market.
The ICE BofA High Yield CCC Index is a capitalization-weighted index of U.S. dollar-denominated below-investment-grade corporate debt rated CCC and publicly issued in the U.S. domestic market.
The ISM Manufacturing Index is a monthly indicator of U.S. economic activity based on a survey of purchasing managers at more than 300 manufacturing firms. It is considered to be a key indicator of the state of the U.S. economy.
The Ivey Purchasing Managers Index is prepared by the Ivey Business School and is an economic index that measures the month-to-month variation in economic activity as indicated by a panel of purchasing managers from across Canada.
The MSCI Canada Index is designed to measure the performance of the large- and mid-cap segments of the Canada market. With 91 constituents, the Index covers approximately 85% of the free float-adjusted market capitalization in Canada.
The MSCI China Index captures large- and mid-cap representation across China H shares, B shares, Red chips, P chips and foreign listings such as ADRs. With 469 constituents, the Index covers about 85% of this China equity universe. Currently, the Index also includes large-cap A shares represented at 5% of their free float-adjusted market capitalization.
The MSCI Emerging Markets Asia Index is designed to measure the performance of the large- and mid-cap segments across nine emerging-market countries in Asia.
The MSCI Emerging Markets Index is a free float-adjusted market-capitalization-weighted index designed to measure the performance of global emerging-market equities.
The MSCI Europe, Middle East and Africa Index is designed to measure the performance of large- and mid-cap stocks across 12 emerging markets countries in Europe, the Middle East and Africa (EMEA). With 163 constituents, the Index covers approximately 85% of the free float-adjusted market capitalization in each country.
The MSCI France Index is designed to measure the performance of large- and mid-cap stocks in France.
The MSCI Germany Index is designed to measure the performance of large- and mid-cap stocks in Germany.
The MSCI Japan Index is designed to measure the performance of large- and mid-cap stocks in Japan.
The MSCI Emerging Markets Latin America Index is designed to measure the performance of the large- and mid-cap segments across six emerging-market countries in Latin America.
The MSCI United Kingdom Index is a free float-adjusted market-capitalization-weighted index designed to measure the performance of large- and mid-capitalization stocks in the U.K.
The MSCI USA Index measures the performance of the large- and mid-cap segments of the U.S. market.
The MSCI World Index is a free float-adjusted market-capitalization-weighted index that is designed to measure the equity-market performance of developed markets.
The MSCI World ex USA Index is a free float-adjusted market-capitalization-weighted index that is designed to measure the equity-market performance of developed markets, excluding the U.S.
The Personal Consumption Expenditures (PCE) Price Index is the primary inflation index used by the Federal Reserve when making monetary policy decisions.
The S&P 500 Index is an unmanaged, market-weighted index that consists of 500 of the largest publicly traded U.S. companies and is considered representative of the broad U.S. stock market.
The S&P 500 Growth Index measures the performance of growth stocks in the S&P 500 Index. The S&P 500 Momentum Index measures the performance of securities in the S&P 500 Index that exhibit persistence in their relative performance.
The S&P 500 Value Index measures U.S. value stocks using three factors: the ratios of book value, earnings, and sales to price.
The University of Michigan Consumer Sentiment Index is a monthly survey of consumer confidence levels in the U.S. conducted by the University of Michigan. Consumer sentiment is a statistical measurement of the overall health of the economy as determined by consumer opinion.
Important Information
SEI Investments Canada Company, a wholly owned subsidiary of SEI Investments Company, is the Manager of the SEI Funds in Canada.
The information contained herein is for general and educational information purposes only and is not intended to constitute legal, tax, accounting, securities, research or investment advice regarding the Funds or any security in particular, nor an opinion regarding the appropriateness of any investment. This commentary has been provided by SEI Investments Management Corporation (“SIMC”), a U.S. affiliate of SEI Investments Canada Company. SIMC is not registered in any capacity with any Canadian regulator, nor is the author, and the information contained herein is for general information purposes only and is not intended to constitute legal, tax, accounting, securities, or investment advice, nor an opinion regarding the appropriateness of any investment. You should not act or rely on the information contained herein without obtaining specific legal, tax, accounting and investment advice from qualified professionals. This information should not be construed as a recommendation to purchase or sell a security, derivative or futures contract. You should not act or rely on the information contained herein without obtaining specific legal, tax, accounting and investment advice from an investment professional. This material represents an assessment of the market environment at a specific point in time and is not intended to be a forecast of future events, or a guarantee of future results. There is no assurance as of the date of this material that the securities mentioned remain in or out of the SEI Funds.
This material may contain "forward-looking information" ("FLI") as such term is defined under applicable Canadian securities laws. FLI is disclosure regarding possible events, conditions or results of operations that is based on assumptions about future economic conditions and courses of action. FLI is subject to a variety of risks, uncertainties and other factors that could cause actual results to differ materially from expectations as expressed or implied in this material. FLI reflects current expectations with respect to current events and is not a guarantee of future performance. Any FLI that may be included or incorporated by reference in this material is presented solely for the purpose of conveying current anticipated expectations and may not be appropriate for any other purposes.
There are risks involved with investing, including loss of principal. Diversification may not protect against market risk. There may be other holdings which are not discussed that may have additional specific risks. In addition to the normal risks associated with investing, international investments may involve risk of capital loss from unfavourable fluctuation in currency values, from differences in generally accepted accounting principles or from economic or political instability in other nations. Emerging markets involve heightened risks related to the same factors, in addition to those associated with their relatively small size and lesser liquidity. Bonds and bond funds will decrease in value as interest rates rise.
Information contained herein that is based on external sources is believed to be reliable, but is not guaranteed by SEI Investments Canada Company, and the information may be incomplete or may change without notice.
Commissions, trailing commissions, management fees and expenses all may be associated with mutual fund investments. Please read the prospectus before investing. Mutual funds are not guaranteed, their values change frequently and past performance may not be repeated.


